Are Complex Investment Strategies Harmful to Investors?
Complex investment strategies are not always bad. Derivatives, futures, options, leverage and structured products can all have sensible and practical uses that make products that otherwise wouldn’t be possible, possible. The problem with complexity, though, is that it often makes risk harder to understand and can leave naïve investors in serious financial trouble. For example, a simple S&P 500 tracker is easy to understand. You own the market, it goes up and down and you expect to earn a premium over time. A 3x leveraged S&P 500 strategy is quite different. It may sound like ‘the S&P 500, but more of it’, but that is not really what it is. It is a financed, leveraged exposure where gains, losses, costs and behavioural pressure are all magnified. The easiest way to see this is through the numbers.
Why Use Spread Betting as the Example?
There are plenty of strategies online showing how an investor could use spread betting, contracts for difference, futures or leveraged exchange-traded products to gain magnified exposure to equity markets. Indeed, I found this video online several years ago:
https://www.youtube.com/watch?v=1hzb_zIIdmY
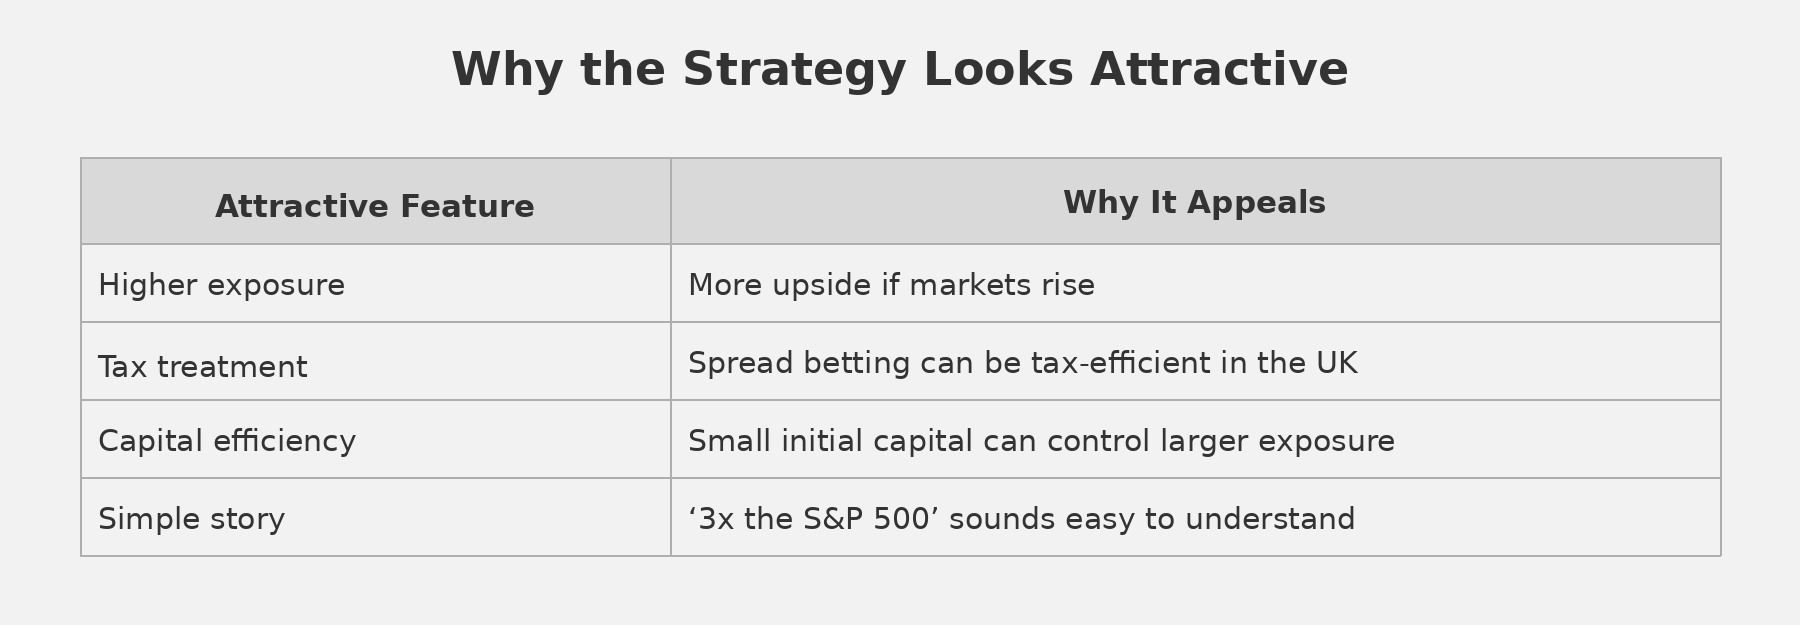
One common version is a managed futures trend-following strategy: take an index such as the S&P 500, apply leverage, rebalance periodically and let the long-term equity premium do the work. I.e., bet on the S&P 500 increasing in value over time. On paper, this can look very attractive. The S&P 500 has produced strong long-term returns, and leverage magnifies those returns during favourable periods.
For a UK investor, spread betting can look especially appealing because capital gains are generally free from capital gains tax and stamp duty. Providers such as CMC Markets also make it relatively easy to gain exposure to major indices, including the US 500 or S&P 500-style markets, without buying the underlying shares directly.
But that convenience can make the strategy feel simpler than it really is.
A spread bet is not the same as owning an S&P 500 index fund. It is a leveraged derivative position. The investor is taking exposure to the movement of the index, usually with a relatively small amount of capital supporting a much larger notional position. That means the investor is exposed not only to the direction of the market, but also to financing costs, spreads, margin requirements and the risk of being forced out during a sharp fall.
I use CMC Markets as the example here not because there is anything uniquely wrong with CMC, but because I was closely monitoring whether it made sense to follow a strategy such as this using their platform several years ago. It also gives us a practical way to model realistic spread betting costs. The broader point applies to the structure, not one specific provider.
The question is therefore not simply:
‘Would 3x the S&P 500 have made money?’
The better question is:
‘What would this have looked like after costs, drawdowns and real-world constraints?’
That is what the numbers below are designed to show.
Example: 3x Leverage on the S&P 500
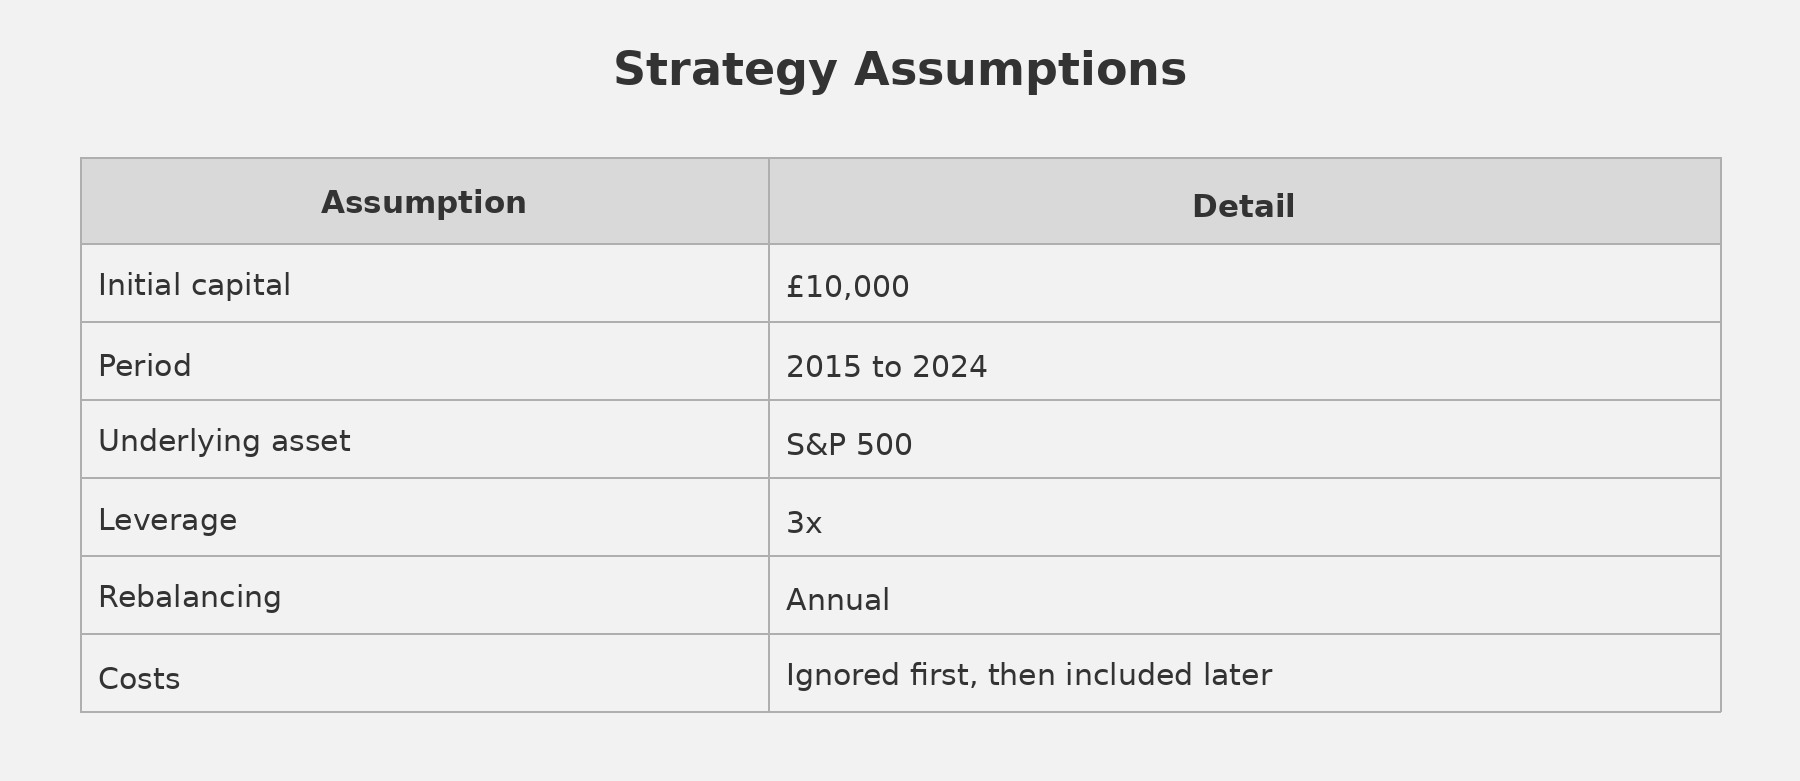
The idea is simple. Each year, the investor takes the S&P 500 total return and applies three times that return to the portfolio.
If the S&P 500 rises by 10%, the leveraged portfolio rises by roughly 30%.
If the S&P 500 falls by 10%, the leveraged portfolio falls by roughly 30%.
Step 1: S&P 500 Annual Returns
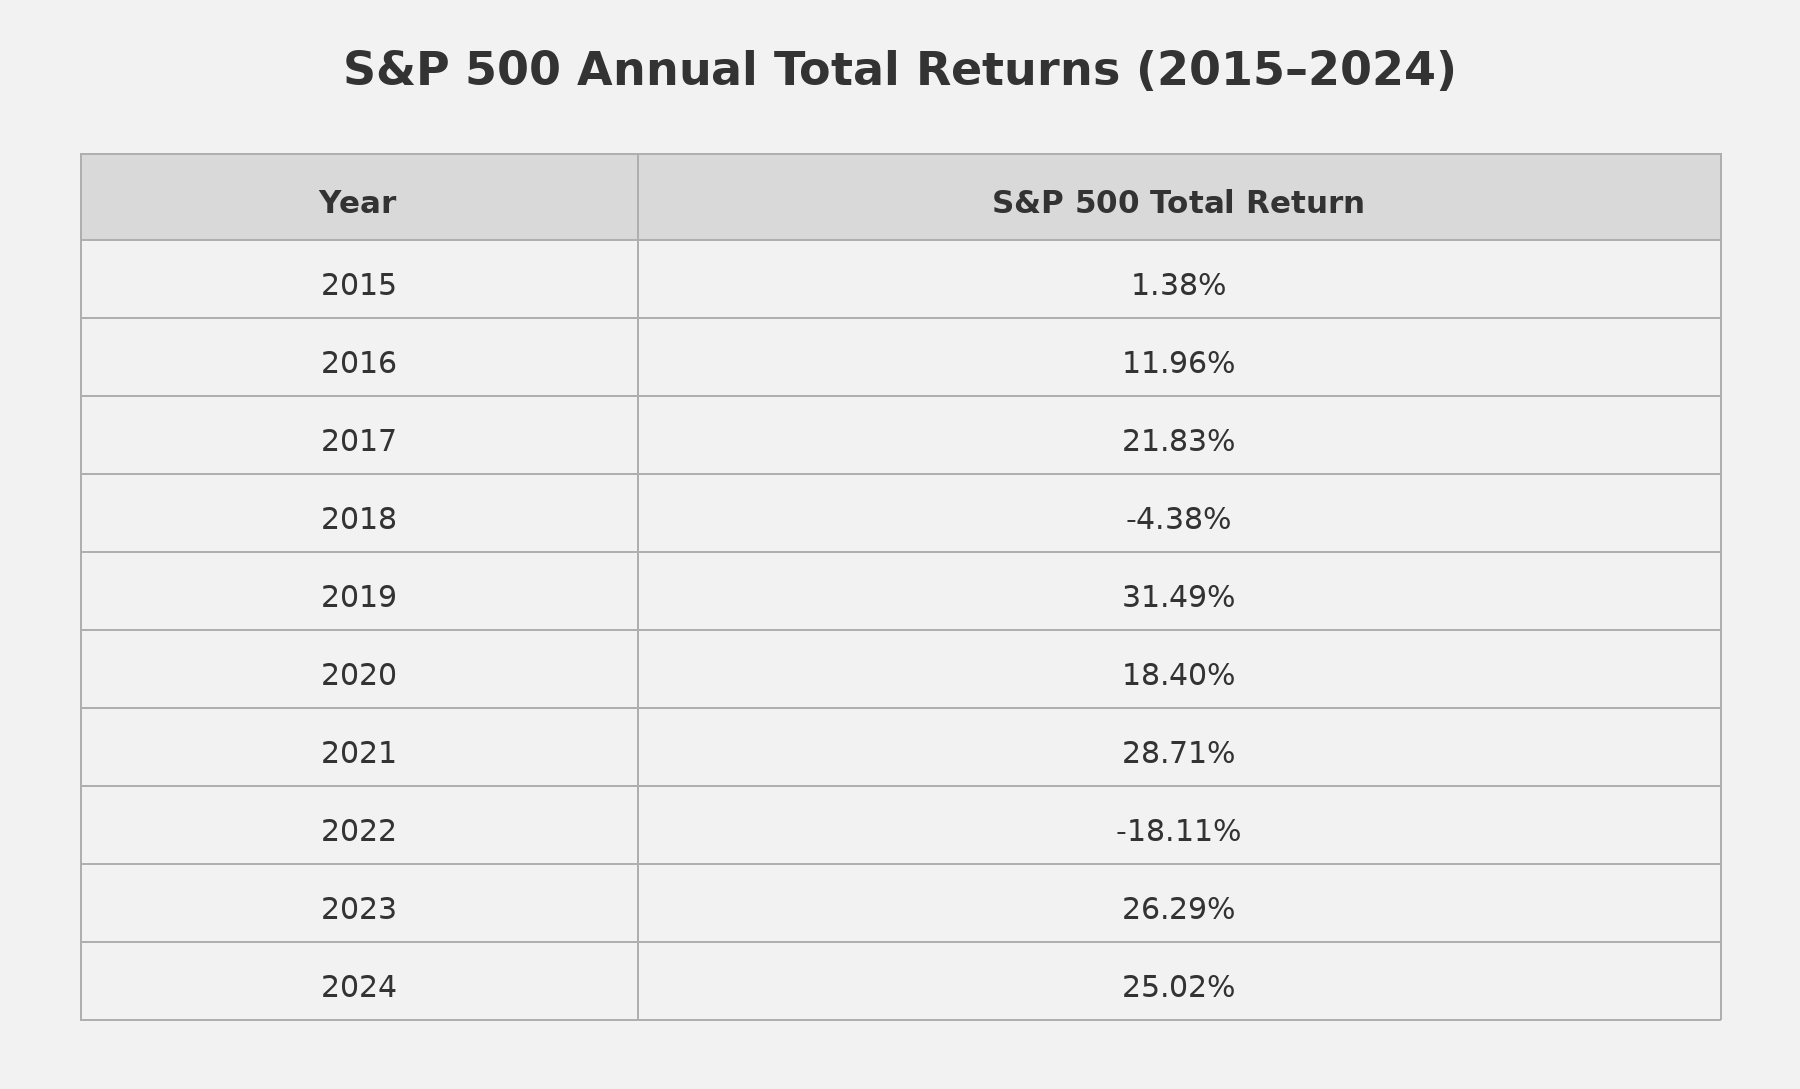
This was a very favourable decade for US equities. There were weak years, particularly 2018 and 2022, but the overall outcome was strong. This matters because leverage looks best after a strong market. The decade gives us a useful example of why investors become interested in these strategies in the first place.
Step 2: Apply 3x Leverage
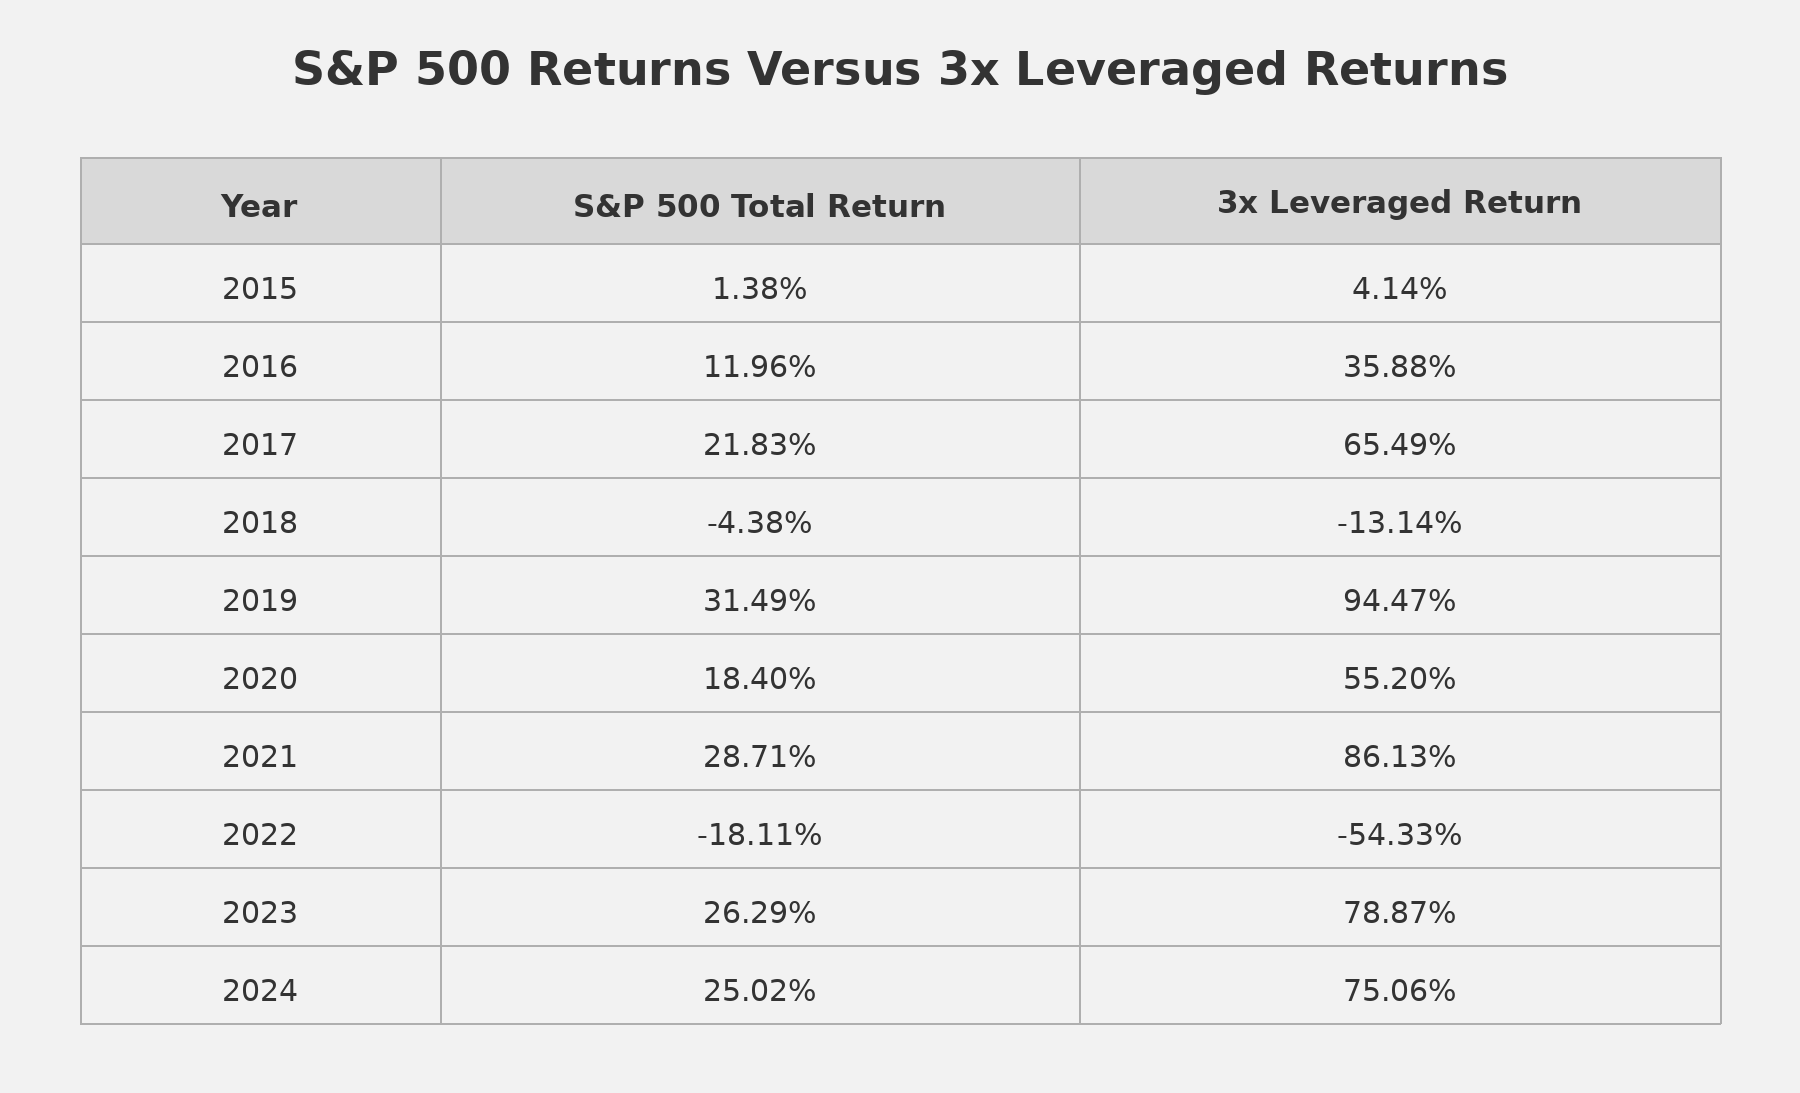
This table shows the attraction and the danger.
In 2019, the S&P 500 returned 31.49%. At 3x leverage, that becomes 94.47%.
In 2021, the S&P 500 returned 28.71%. At 3x leverage, that becomes 86.13%.
But in 2022, the S&P 500 fell by 18.11%. At 3x leverage, that becomes a loss of 54.33%.
This is the key trade-off. Leverage does not only increase the exciting years. It also makes the bad years much harder to tolerate.
Step 3: Portfolio Values With Annual Rebalancing
Starting with £10,000, the gross 3x leveraged portfolio develops as follows.
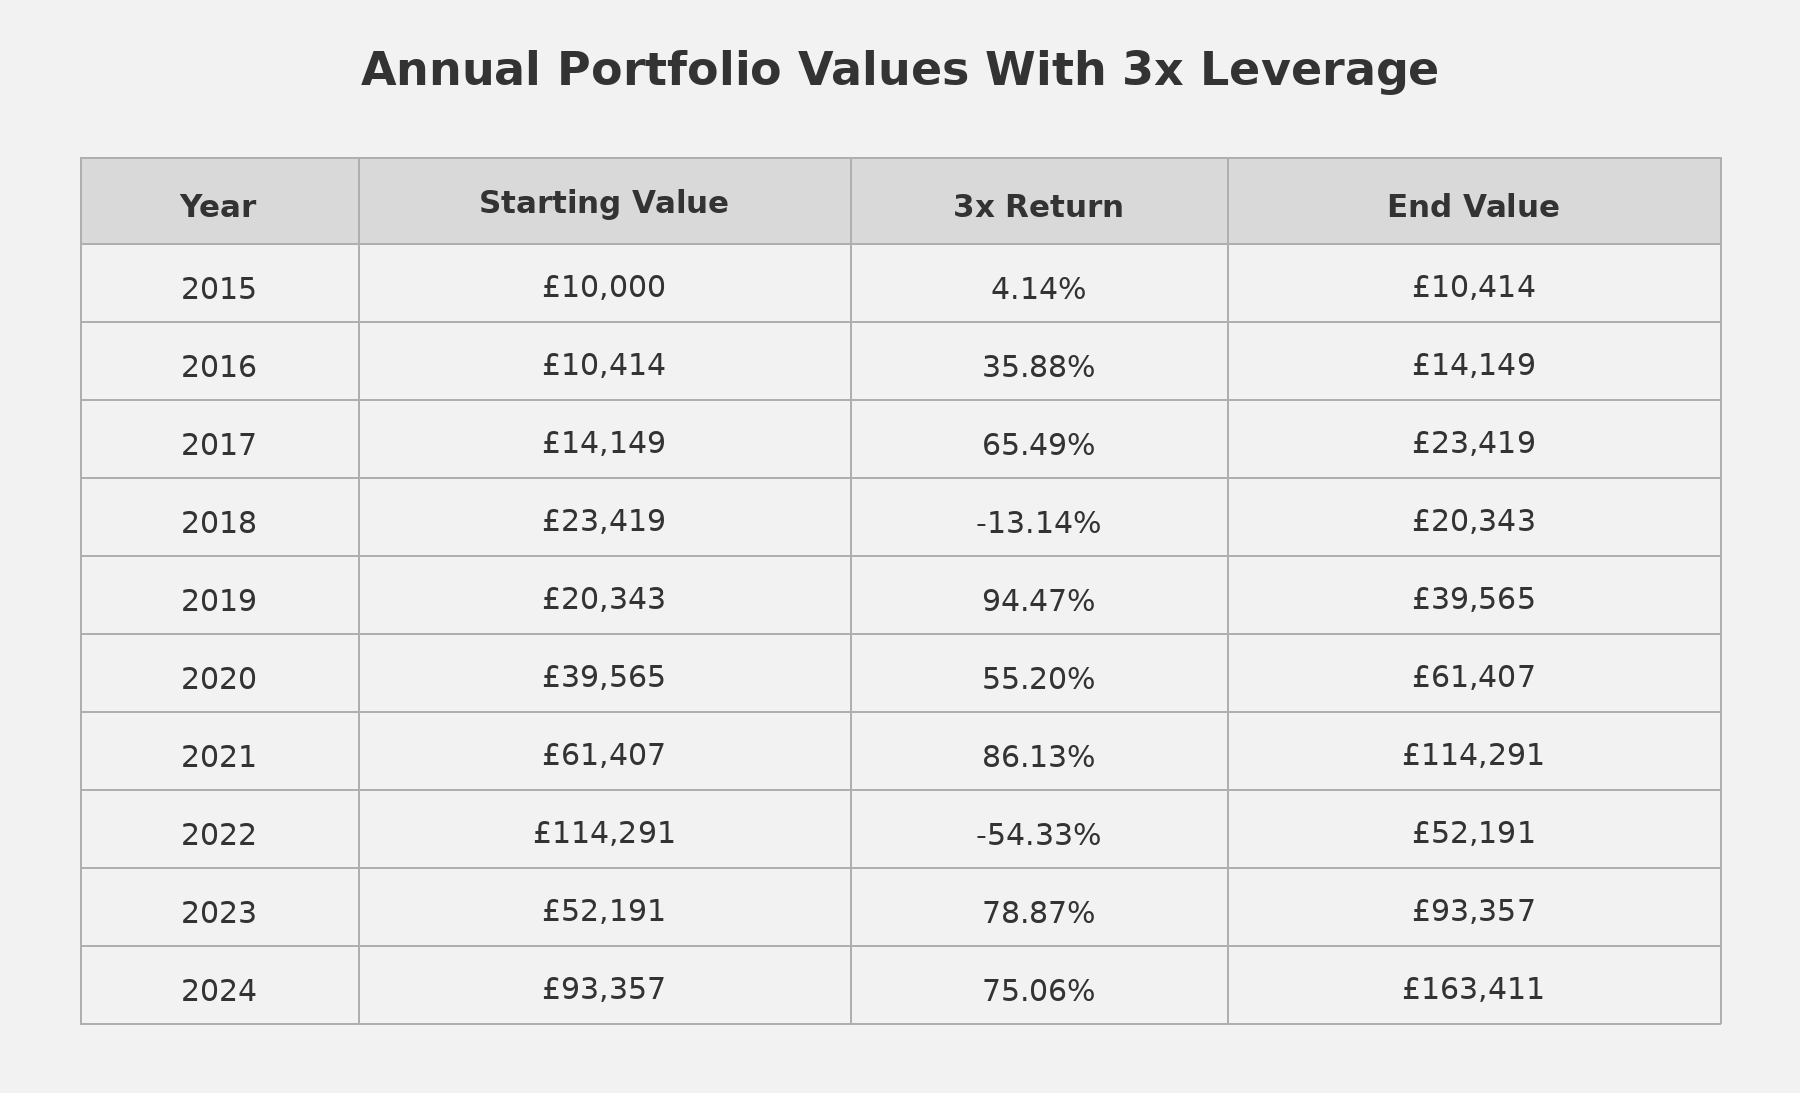
Before costs, this looks spectacular.
The portfolio rises from £10,000 to approximately £163,000.
But the route is not smooth. The portfolio rises to roughly £114,000 in 2021, then falls to roughly £52,000 in 2022.
That is a loss of more than £60,000 in one year.
It is easy to admire the final number. It is harder to live through the path to getting there.

Chart 1. Portfolio Growth: Unleveraged vs 3x Leveraged (2015-2024).
Step 4: Gross Performance Summary
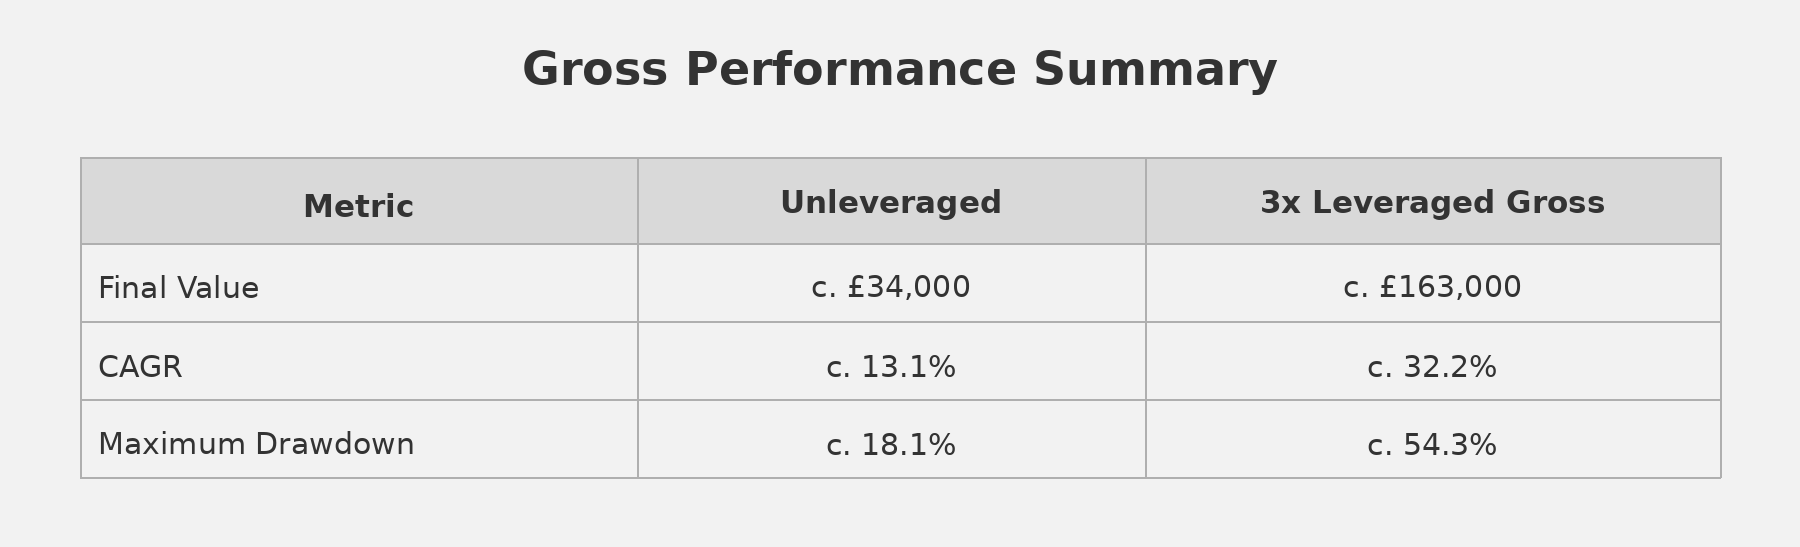
This is the point at which leverage looks most attractive.
The final value is much higher. The compound annual growth rate (CAGR) is much higher.
But the maximum drawdown is also much higher.
A drawdown of 18% is uncomfortable. A drawdown of more than 54% is a different experience entirely. It can lead to panic selling, forced deleveraging or the need to add more capital at exactly the wrong time.
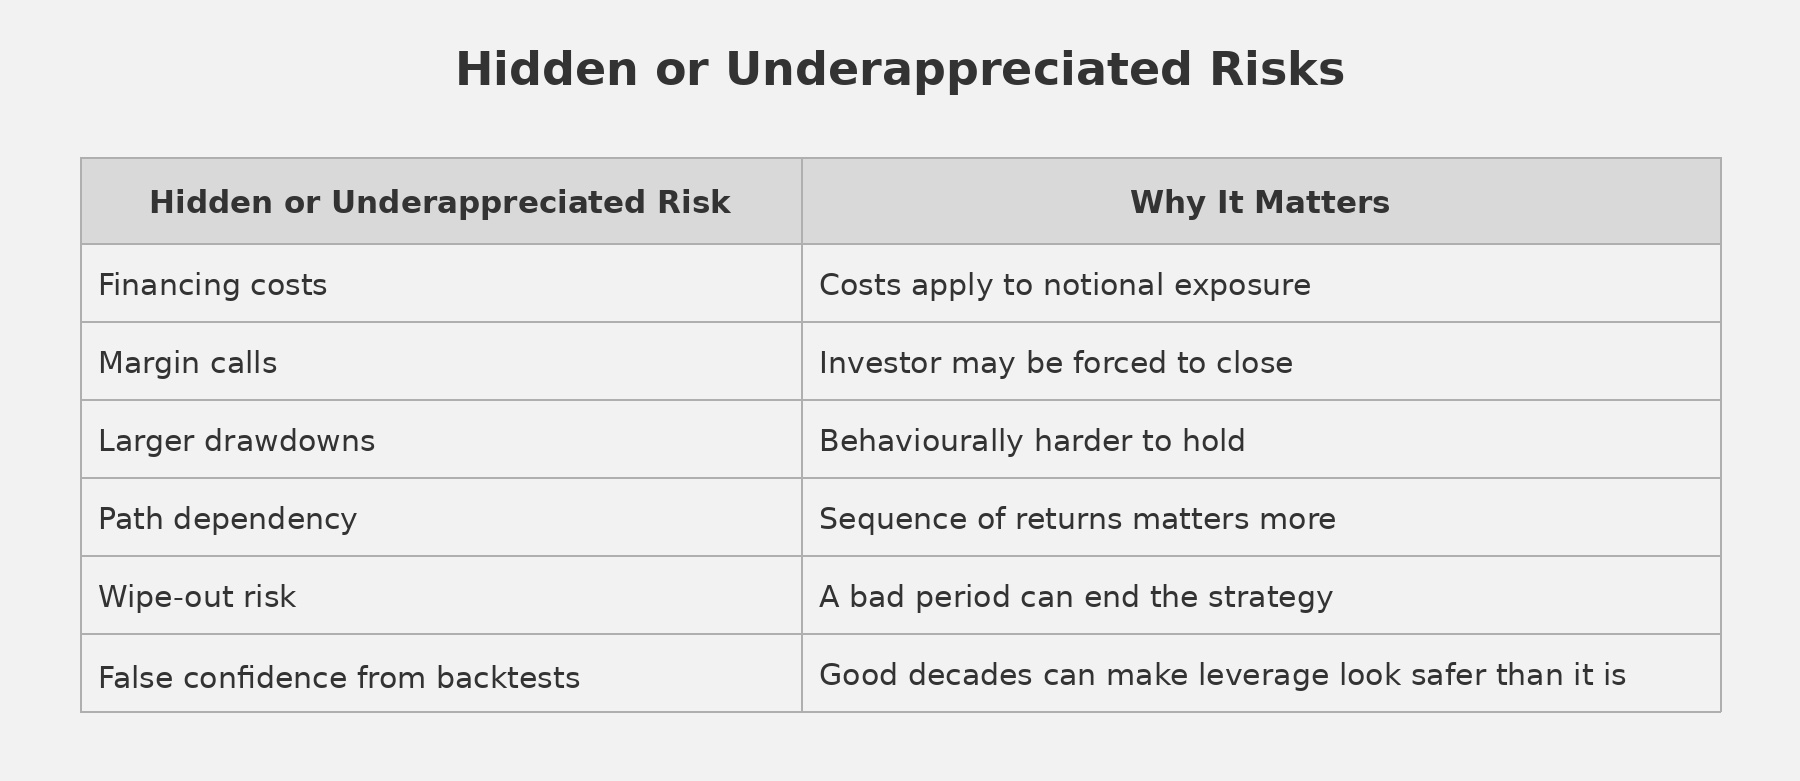
Step 5: Add Spread Betting and Financing Costs
The gross result ignores an important detail: leveraged exposure is not free.
If an investor uses futures, contracts for difference or spread betting, they are effectively financing exposure larger than their account value. The cost applies to the notional exposure, not just the investor’s cash.
So, if an investor has £10,000 and uses 3x leverage, they have around £30,000 of market exposure.
In the chart below, I have shown three versions of the leveraged strategy. The first is the gross 3x result, which assumes no financing costs. The second is a generic net-of-fees version, which assumes a lower annual financing cost of 2.5% on the total notional exposure. The third is a CMC Markets version, which assumes a higher annual financing cost of 5% on the total notional exposure. Again, I have specifically selected CMC Markets here as I was closely monitoring whether it made sense to follow a strategy such as this using their platform several years ago.
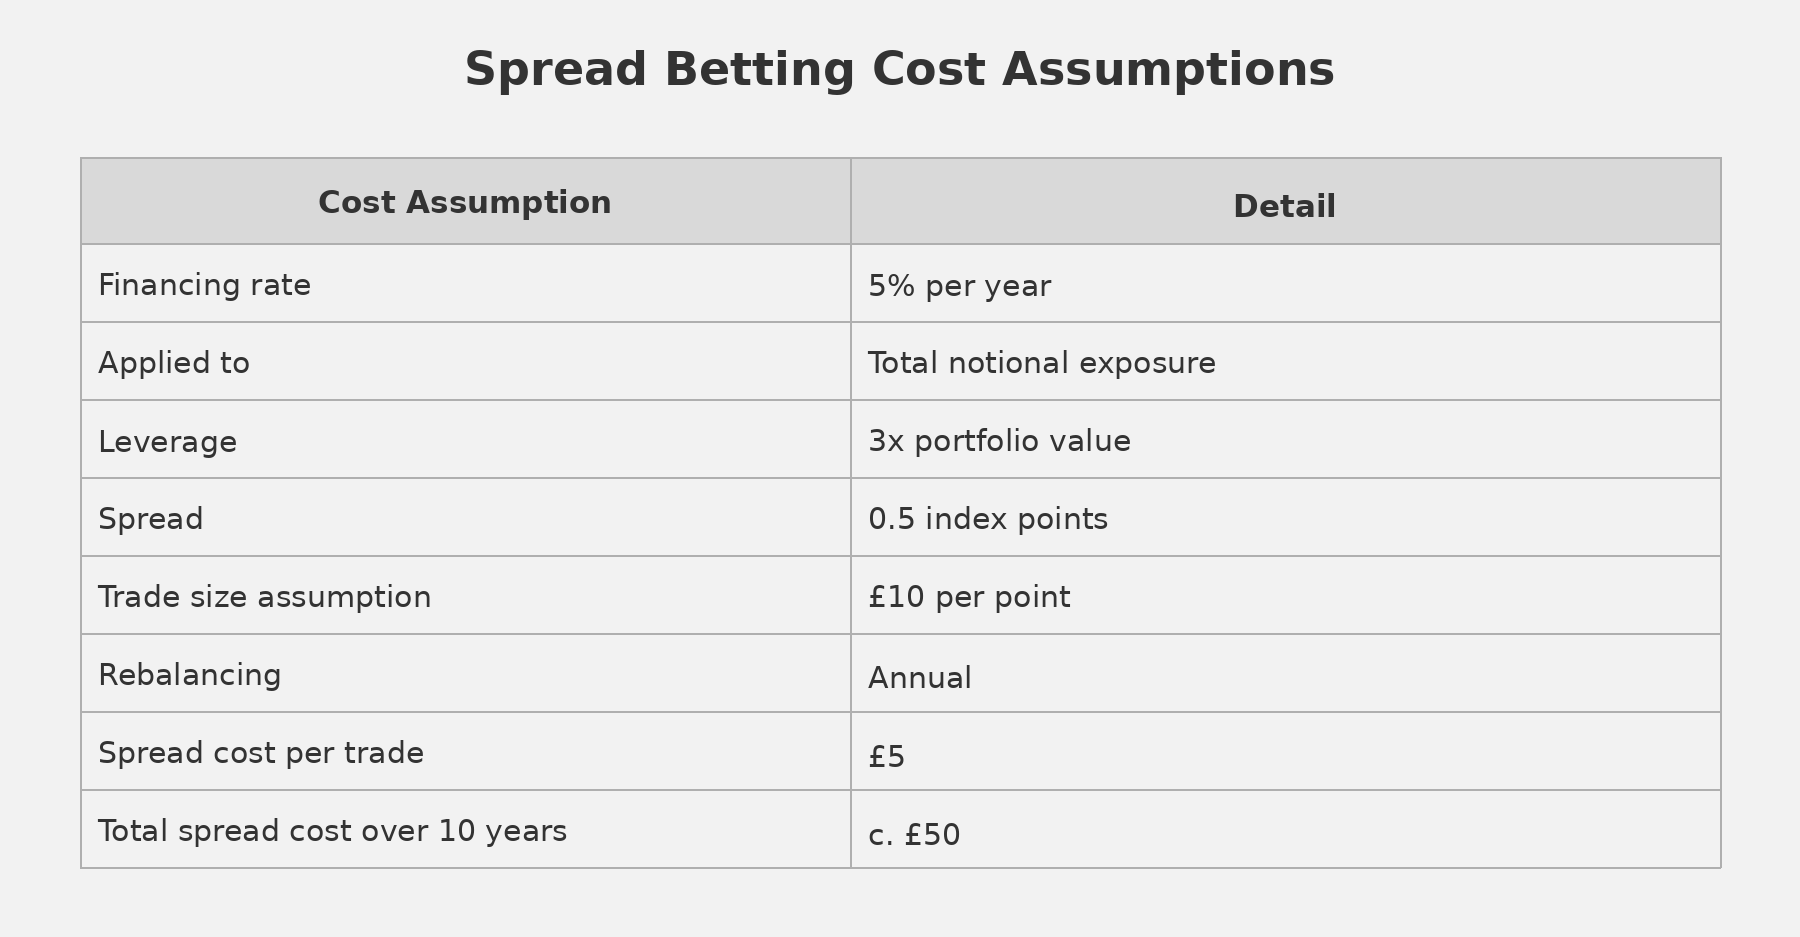
The spread cost is small in this example. The financing cost is the main drag.
This is one of the most important points in the whole article. The investor may think of themselves as having £10,000 invested, but the cost structure is based on a much larger exposure.
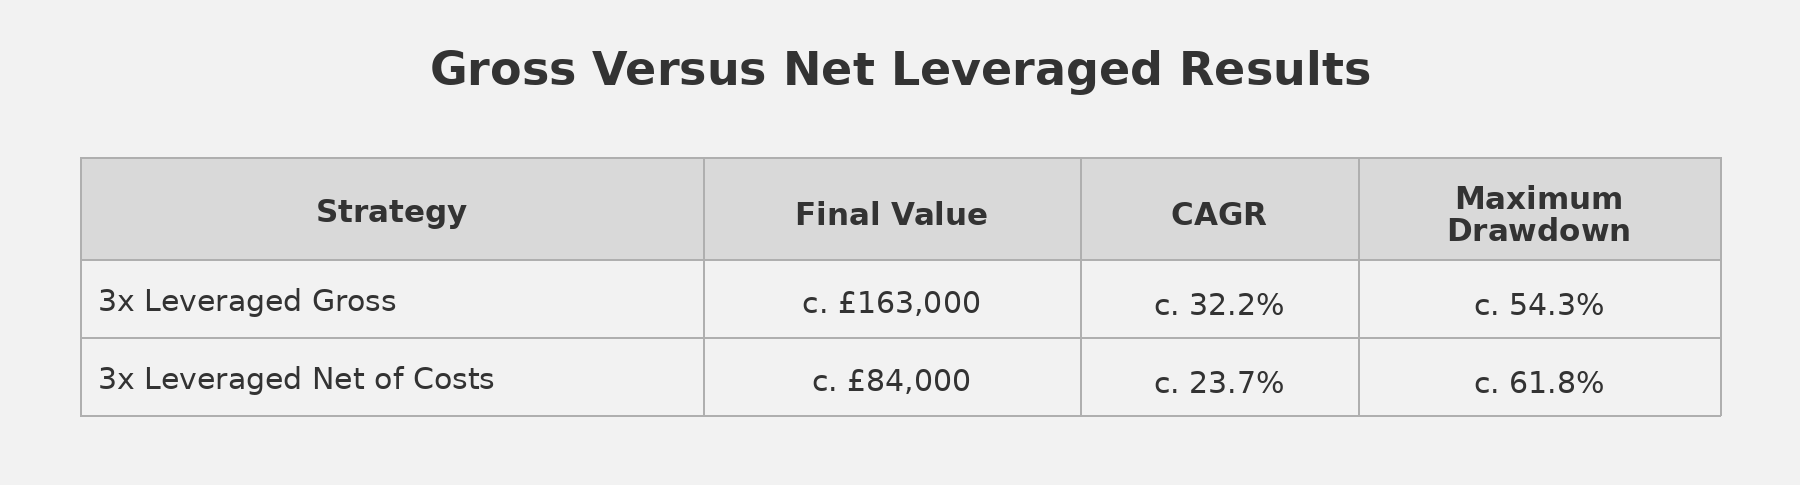
Step 6: Net of Costs
Once financing and spread betting costs are included, the results changes materially. A 5% financing cost is not 5% of the investor’s £10,000 cash balance. It is closer to 5% of the £30,000 notional exposure. That means the annual financing drag is roughly £1,500, or 15% of the investor’s starting capital, before any market return is earned.
The generic net line therefore sits below the gross line because it deducts a financing cost, but it remains above the CMC Markets line because the assumed financing rate is lower. The CMC Markets line sits lowest because the assumed financing cost is higher, creating a larger annual drag on returns.
This is why costs matter so much. The investor may think of themselves as having £10,000 invested, but the cost structure is based on a much larger exposure.
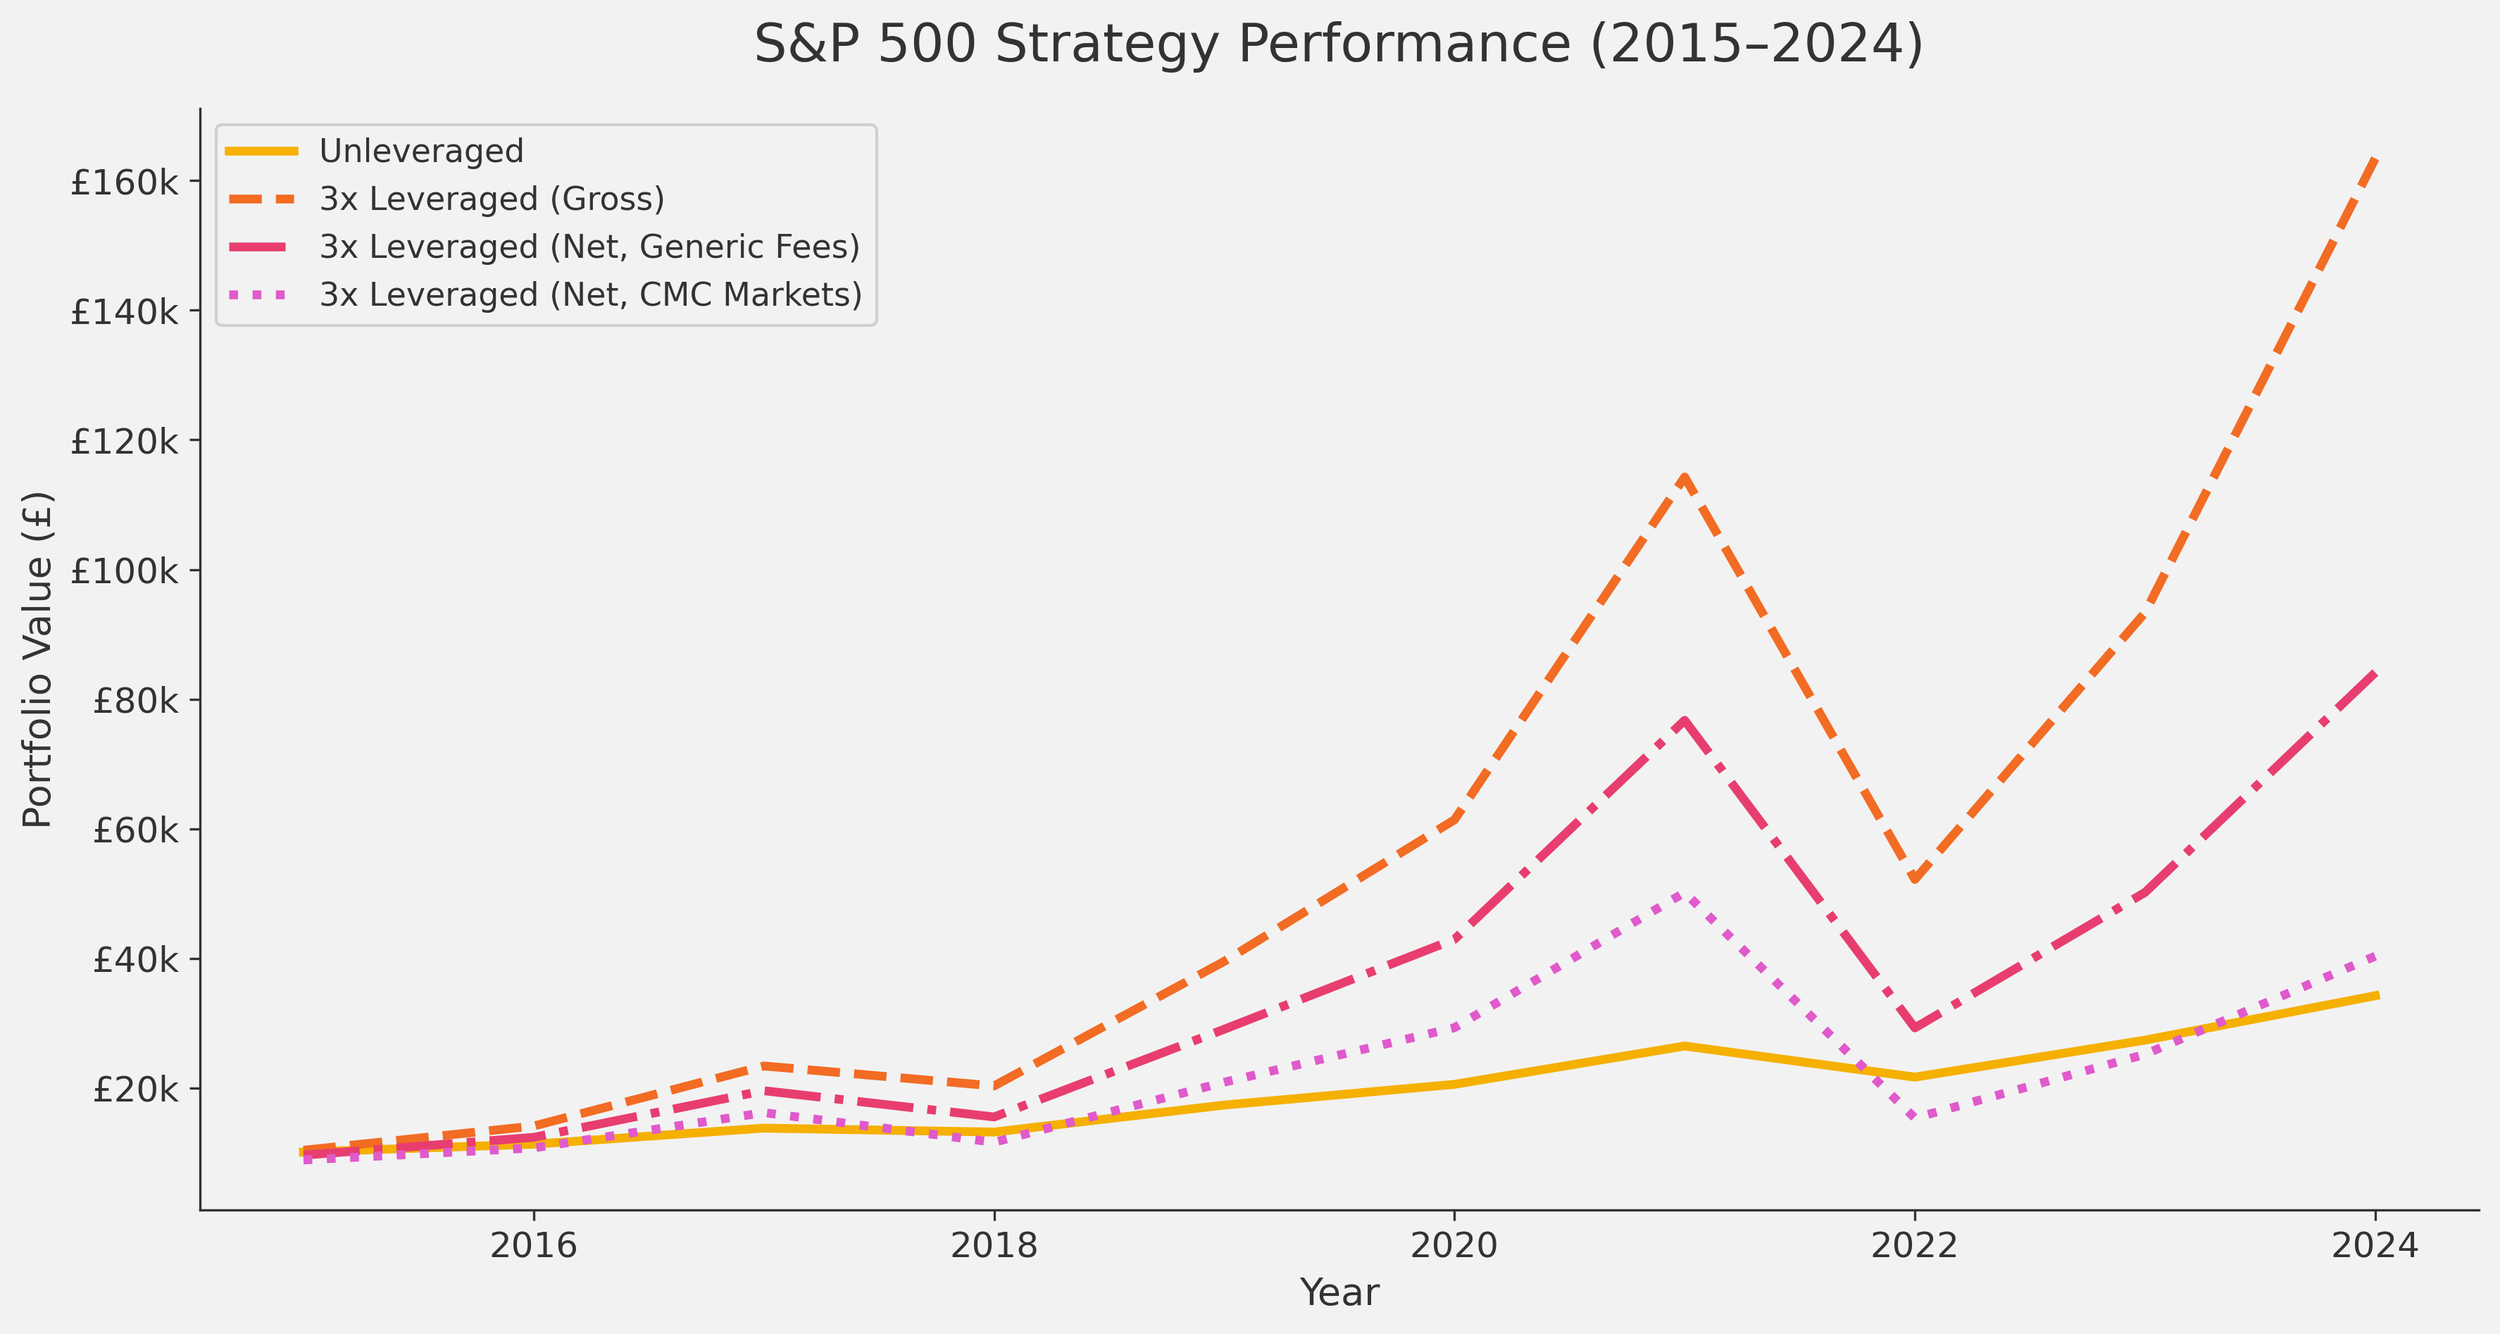
Chart 2. S&P 500 Strategy Performance (2015-2024).
The strategy still performs well because the decade was favourable.
But the difference between £163,000 and £84,000 is enormous. Roughly half the gross result disappears once costs are included. Incredibly, the CMC Markets line barely sits above the unleveraged line by the end of the decade, despite taking significantly more risk.
This is one of the risks of complex strategies. The headline number can be technically true, but not realistic once costs are considered.
Step 7: Risk-Adjusted Performance
Sticking with the generic cost figures, the leveraged portfolio produced a higher return, but it also took far more risk.

The generic leveraged strategy had the higher raw return.
The unleveraged strategy had the better return per unit of risk.
That distinction matters because investors do not experience returns in isolation. They experience returns alongside volatility, drawdowns and stress.
A higher final value is not automatically a better investment strategy if it requires far more risk to get there.
Step 8: The Bad-Decade Test
The 2015 to 2024 period was favourable to leverage. A more useful stress test is 2000 to 2010.
This period included the dot-com crash, the early 2000s bear market and the global financial crisis. This resulted in the S&P 500 having a poor decade. But notice the dramatic difference between unleveraged and leveraged investing during this period. Both the gross of fees and net of fees strategies are completely wiped out whilst the unleveraged strategy just about breaks even.
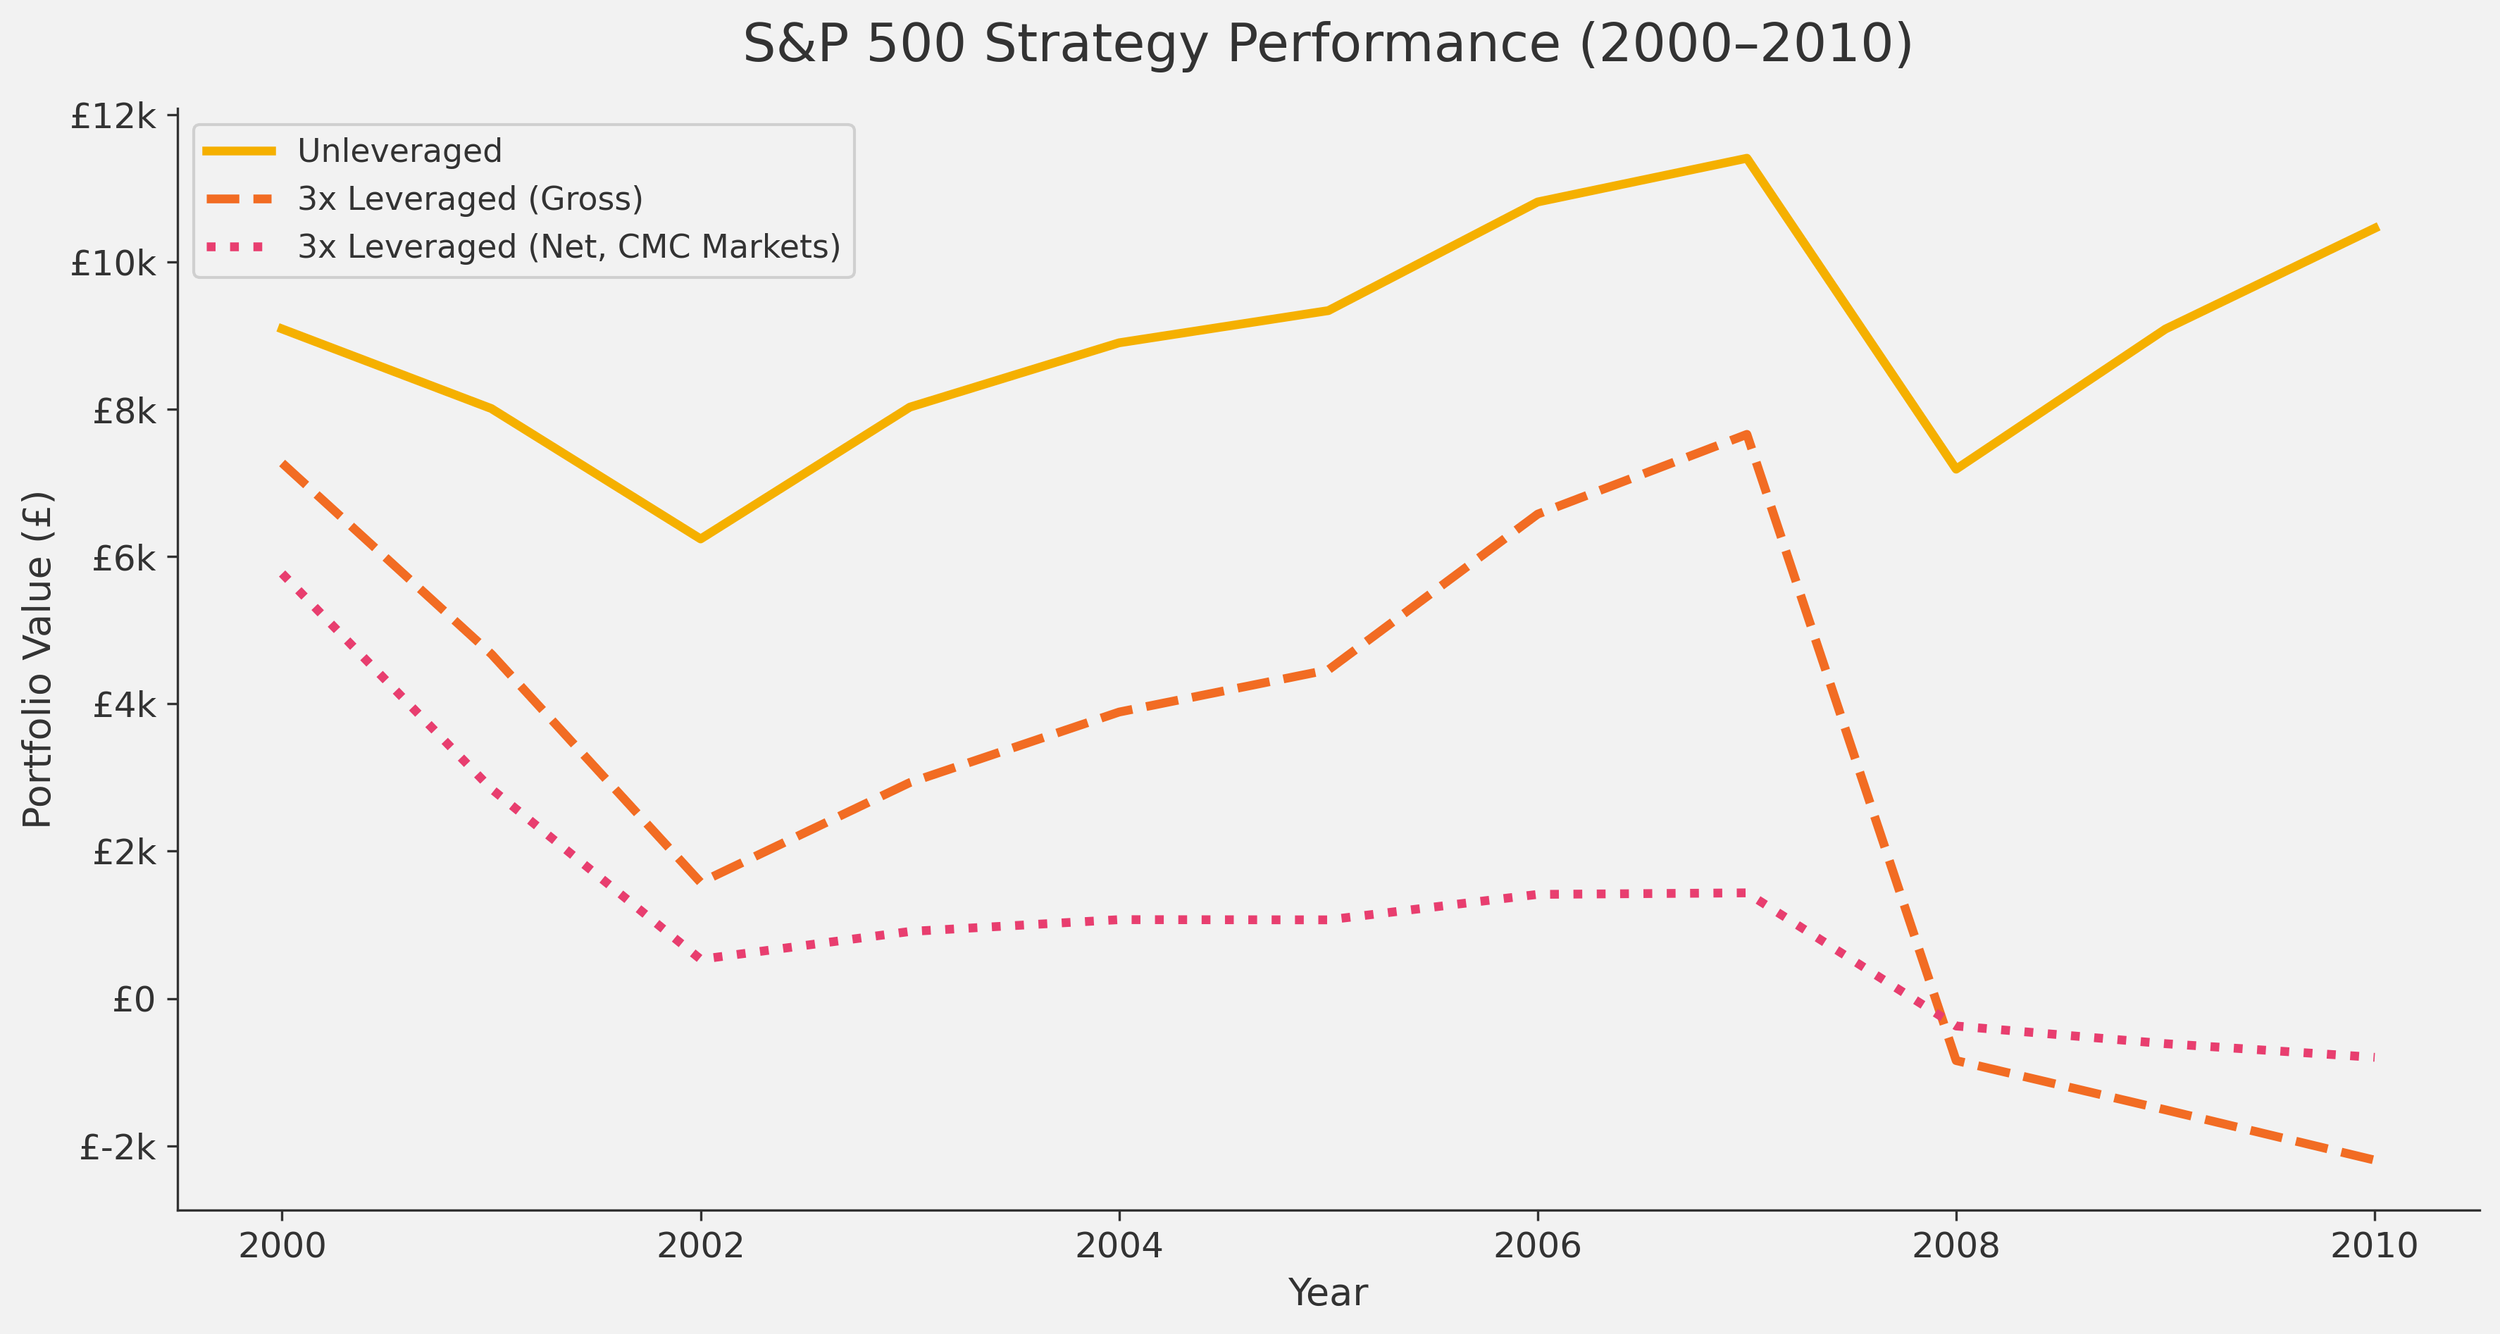
Chart 3. S&P 500 Strategy Performance (2000-2010).
Interestingly, this chart also shows a modelling problem. In a simple spreadsheet, the leveraged lines can fall below zero because the spreadsheet is compounding from a negative number. For example, if the gross portfolio is -£1,000 and the next year’s leveraged return is +20%, it falls further to -£1,200. But if the net version has a cost drag and only returns +5%, so it moves to -£1,050. That makes the net version look ‘better’, even though this is economically meaningless. In reality, the account would have been stopped out or margin-called before going negative, which is why the next chart caps the leveraged strategies at zero.
So the model needs to apply a real-world constraint: once the portfolio reaches zero, it stays at zero.
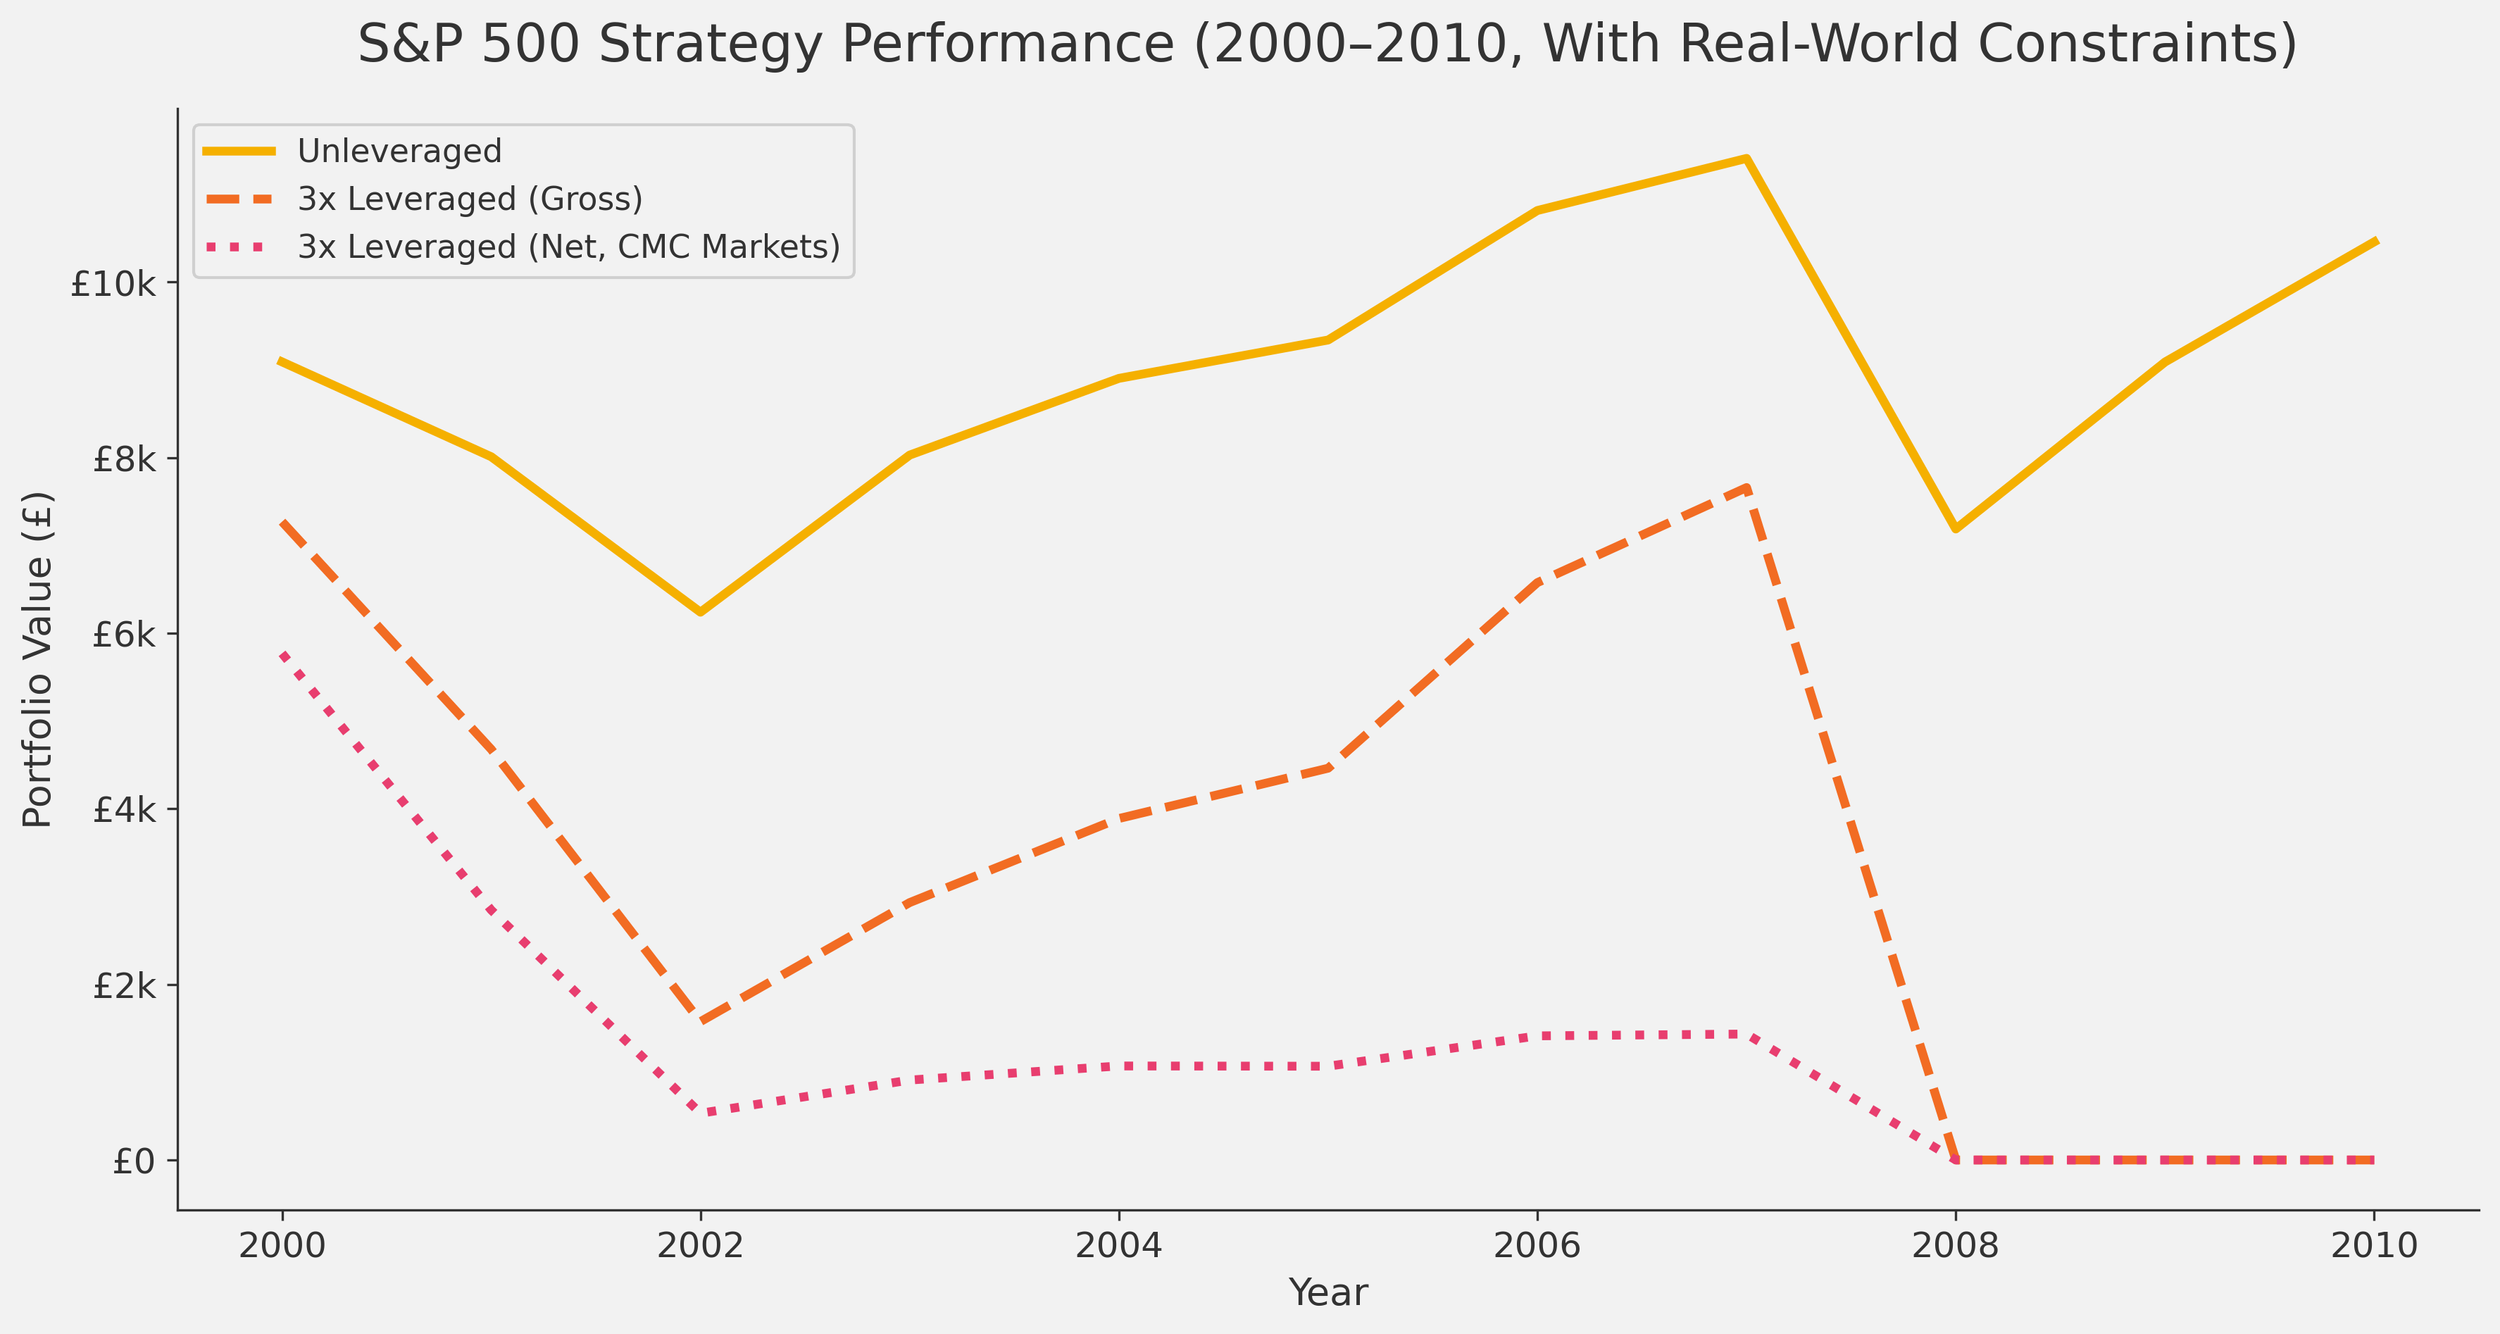
Chart 4. S&P 500 Strategy Performance (2000-2010, With Real-World Constraints).
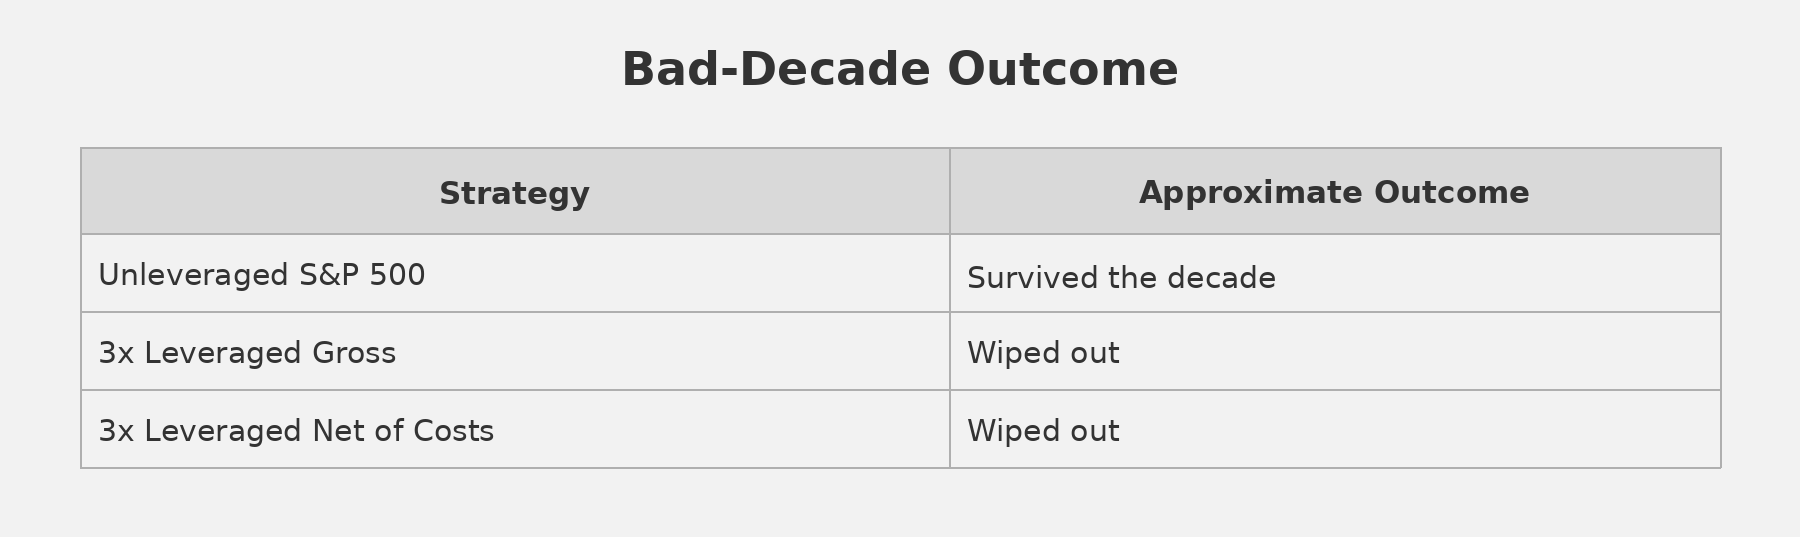
This is the central lesson. A normal equity investor can have a bad decade and still remain invested. A leveraged investor may not get the chance to wait for the recovery even though the underlying asset can be something sensible.
Why This Matters
The question is not simply:
‘Will the S&P 500 go up over the long term?’
The better question is:
‘Can this particular strategy survive the path?’
That is the key difference.
An unleveraged index fund can fall heavily and recover later. A leveraged derivative position can be closed, stopped out or wiped out before the recovery arrives.
That means leverage can turn a long-term investment decision into a short-term survival problem.
Why Complexity Can Harm Investors
Complex strategies can be harmful because they often make the benefit more obvious than the risk.
In this example, the benefits are easy to see.
But the risks are just as important.
This is where complexity becomes dangerous. It can make a fragile strategy feel more manageable than it really is.
Structured Products: A Similar Problem
Structured products are different from leveraged spread betting, but the principle is similar.
They often come with attractive phrases:
‘Defined return’
‘Potential income’
‘Capital protection barrier’
‘Automatic kick-out’
‘No loss unless the index falls by more than 40%’
Those phrases can make the product feel controlled and safe but the investor is inevitably giving up something important in return. I hate to be the bearer of bad news but investment professionals and fund managers are not benevolent people! They do not want to help you for free.
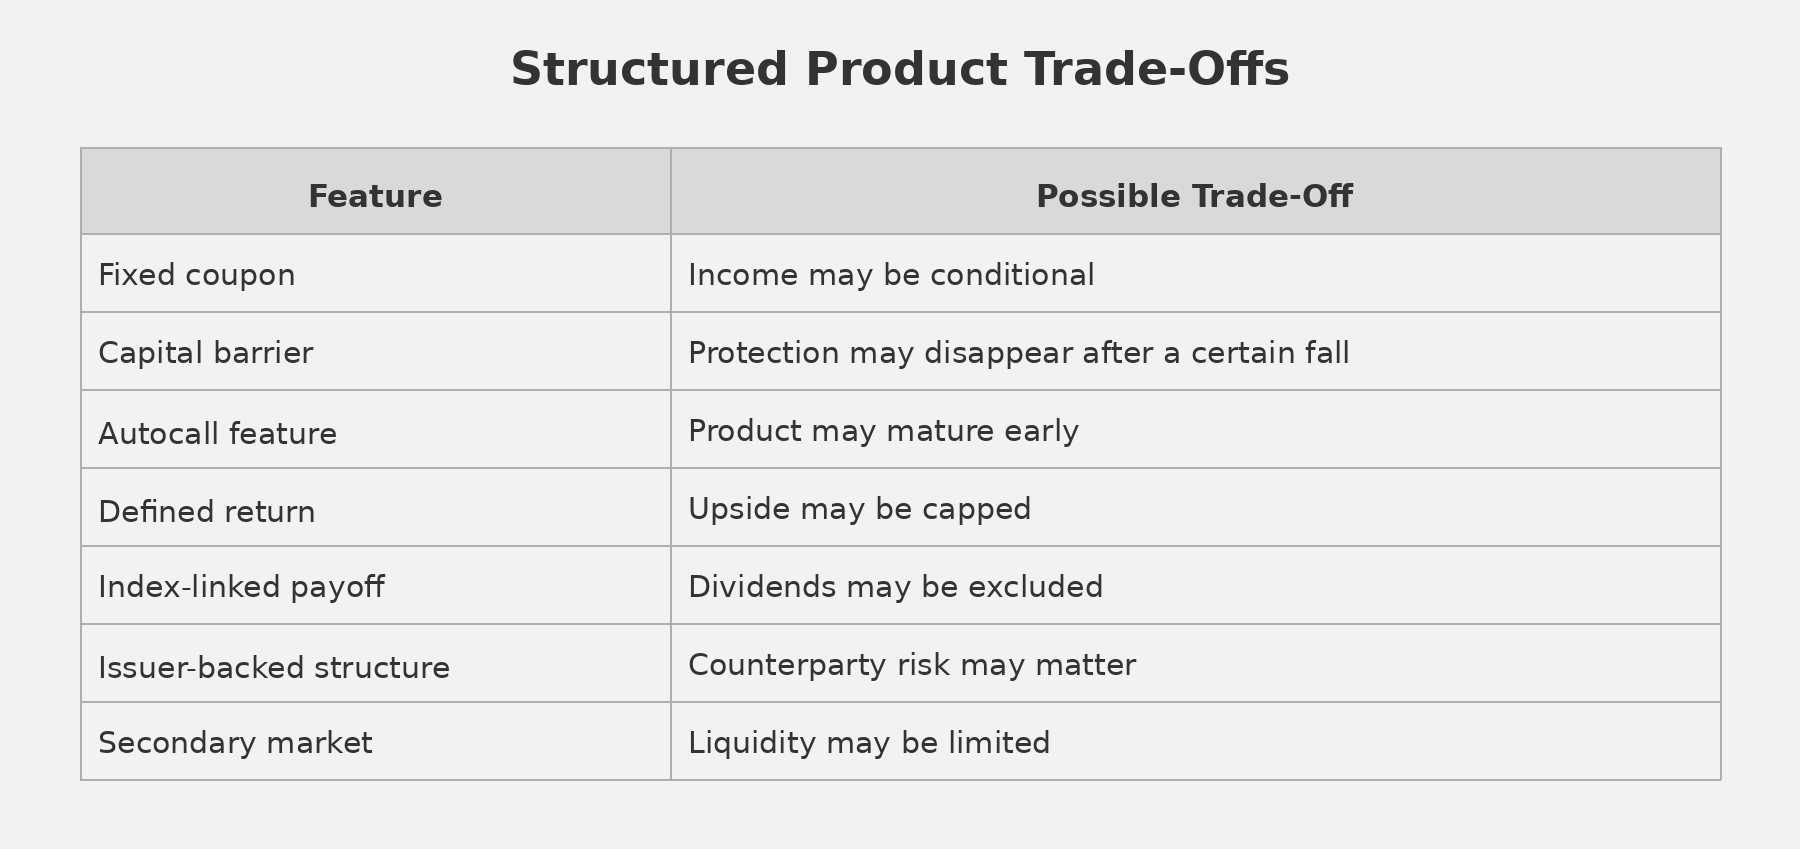
Again, the issue is not that every structured product is poor. The issue is that the headline is often easier to understand than the risk-return trade-off.
The risk has not disappeared. It has been rearranged.
The Simple Test
Before using a complex investment strategy, investors should be able to answer five questions.
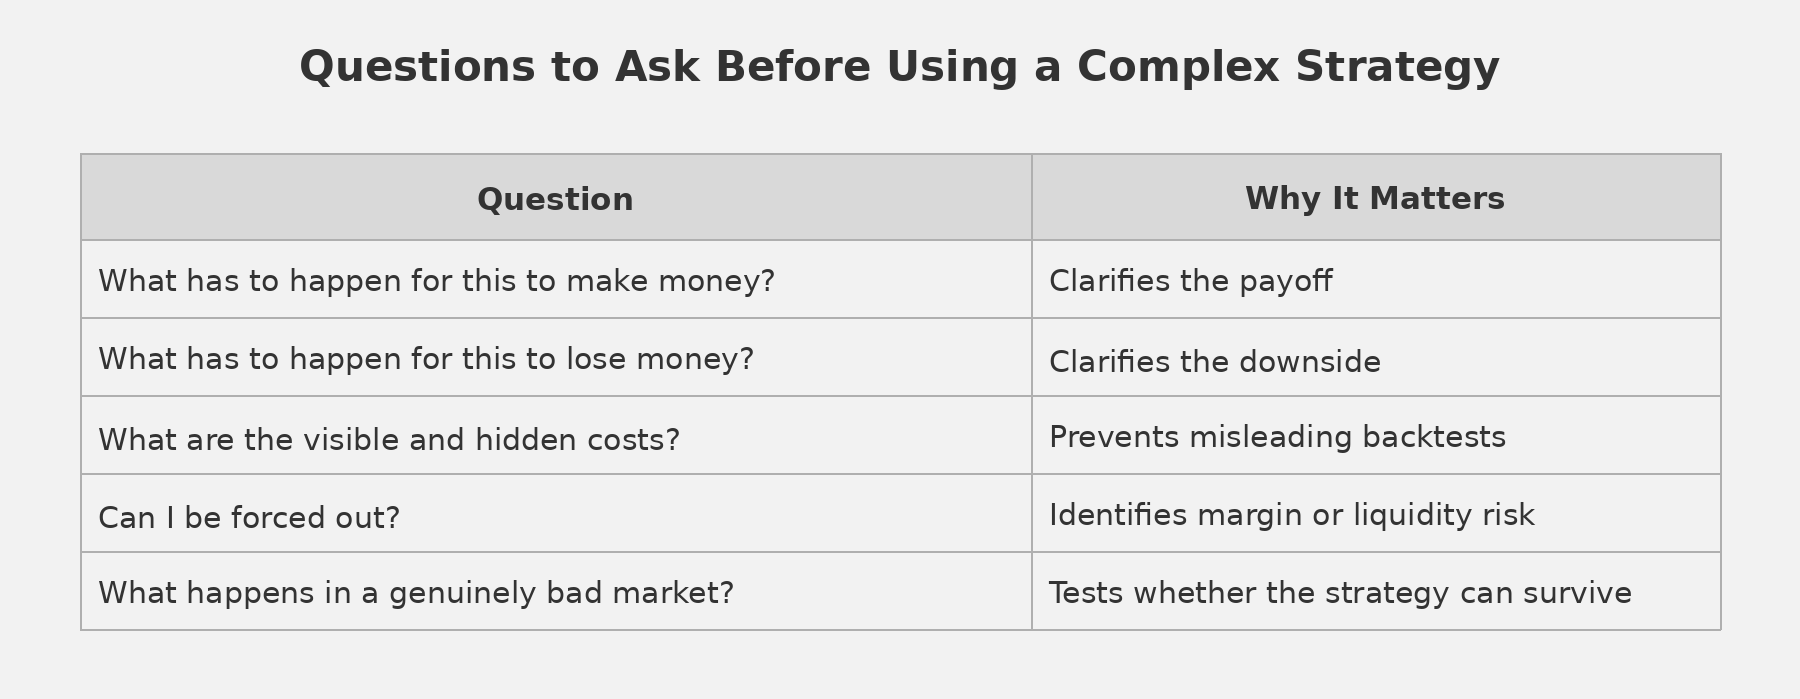
For the 3x S&P 500 example, the plain English version is:
‘I am using borrowed exposure to magnify the S&P 500. If the market rises strongly, I can make much more than an ordinary investor. If the market falls sharply, I can lose most or all of my account. I also pay financing costs on the full exposure, and I may be forced out during a downturn.’
That is very different from the unleveraged version:
‘I am investing in the S&P 500.’
Final Thoughts
The 2015 to 2024 example explains why leverage is tempting. £10,000 could have grown to around £163,000 before costs, or around £84,000 after costs, assuming generic fees. This is compared to the unleveraged £34,000 figure. However, the 2000 to 2010 example explains why leverage is so dangerous. Indeed, the same type of strategy could have been wiped out entirely. And that is the problem with many complex strategies; They can look excellent in favourable markets and fail completely in hostile ones. For most long-term investors, simplicity is not a weakness. A diversified, low-cost portfolio is easier to understand, easier to hold and less likely to force the investor out of the market at the wrong time or worse, lose all of their hard-earned capital entirely.