Featured and Latest Posts

Inflation Swaps In A Short-Duration Bond Fund
If you want UK inflation protection, the obvious route is index-linked gilts. The problem is that the linker market is relatively narrow and often pushes you into longer-duration exposure, so performance can end up being dominated by real-rate duration and price volatility rather than inflation protection. Dimensional’s design choice in the Sterling Short Duration Real Return Fund is to separate those moving parts: keep the bond portfolio short and diversified (including investment-grade credit), then attach inflation sensitivity via an overlay of UK RPI inflation swaps.
That is the key idea: a physical linker bundles inflation linkage with real-rate duration, whereas a swap overlay lets you target inflation exposure without being forced into long duration. The fund is not risk free. Credit spreads can widen, and implementation frictions matter, but the risk mix is different from a linker-heavy approach.

An Assessment of an Equal Weighting Strategy
Market-cap weighted indices let prices set the portfolio weights, so the fund tracks the overall market closely. Equal weighting strategies give every stock the same weight, which is often pitched as a way to avoid ‘bubbles’. However, most of the difference is not magic outperformance. Indeed, it is a different, riskier set of exposures, especially towards smaller and cheaper companies.
Mechanically, equal weighting strategies underweight the biggest firms and overweight small names which results in frequent rebalancing to keep weights equal. That means higher turnover and trading costs, particularly in less liquid stocks. Equal weighting also tends to sell recent winners and buy recent losers, which can blunt upside participation and leave you more exposed to struggling businesses than a market-cap weighted index would.

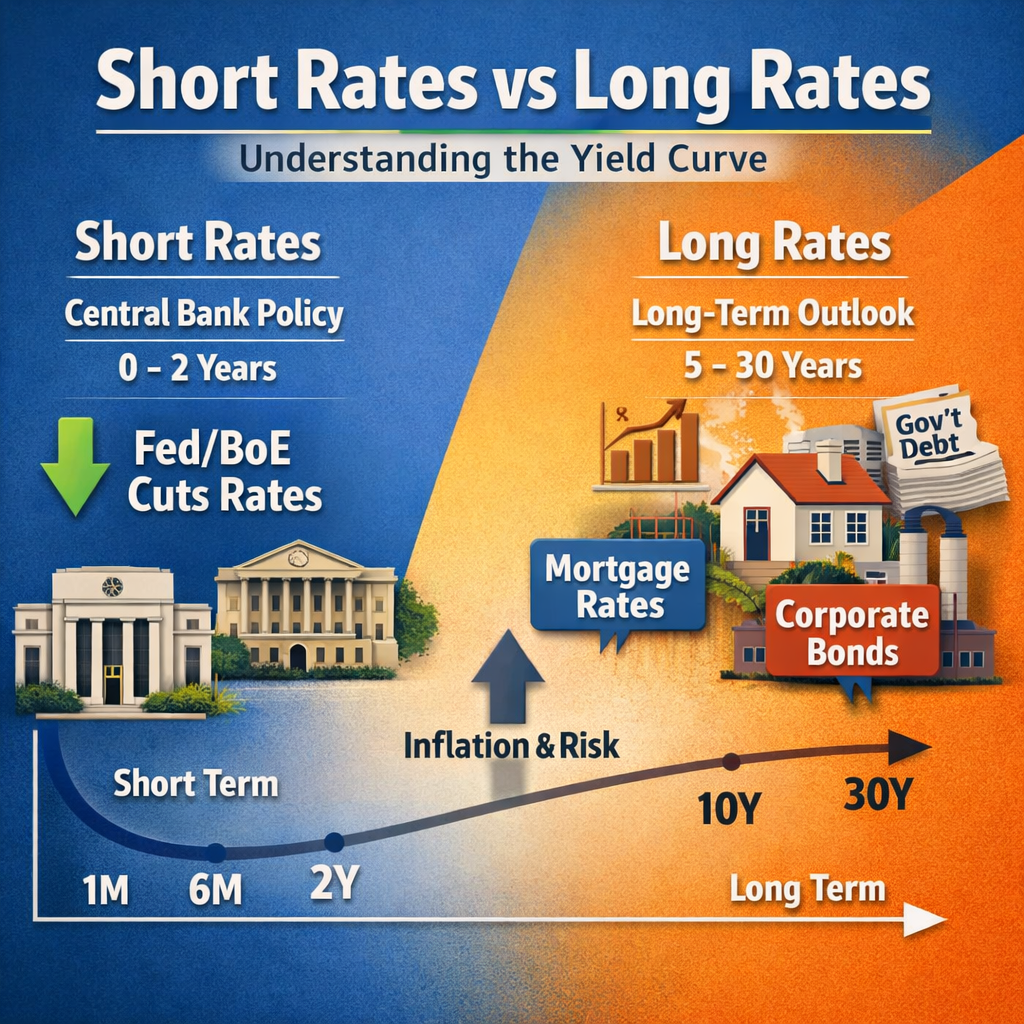
Short Rates Vs Long Rates: Why Central Banks Don’t Set Mortgage Rates
Short rates sit at the front end of the yield curve and mostly reflect what the central bank is doing now and what markets expect over the next year or two. Long rates are set by investors looking out over the next decade, so they reflect longer-run inflation and growth expectations plus extra compensation for uncertainty (the term premium). That’s why the Fed or Bank of England can cut rates whilst long yields barely move: markets may think the cuts won’t last, or they may demand a higher term premium. And because many fixed borrowing costs are priced off longer-term yields plus a spread, mortgages and corporate debt can stay expensive even as policy rates fall.

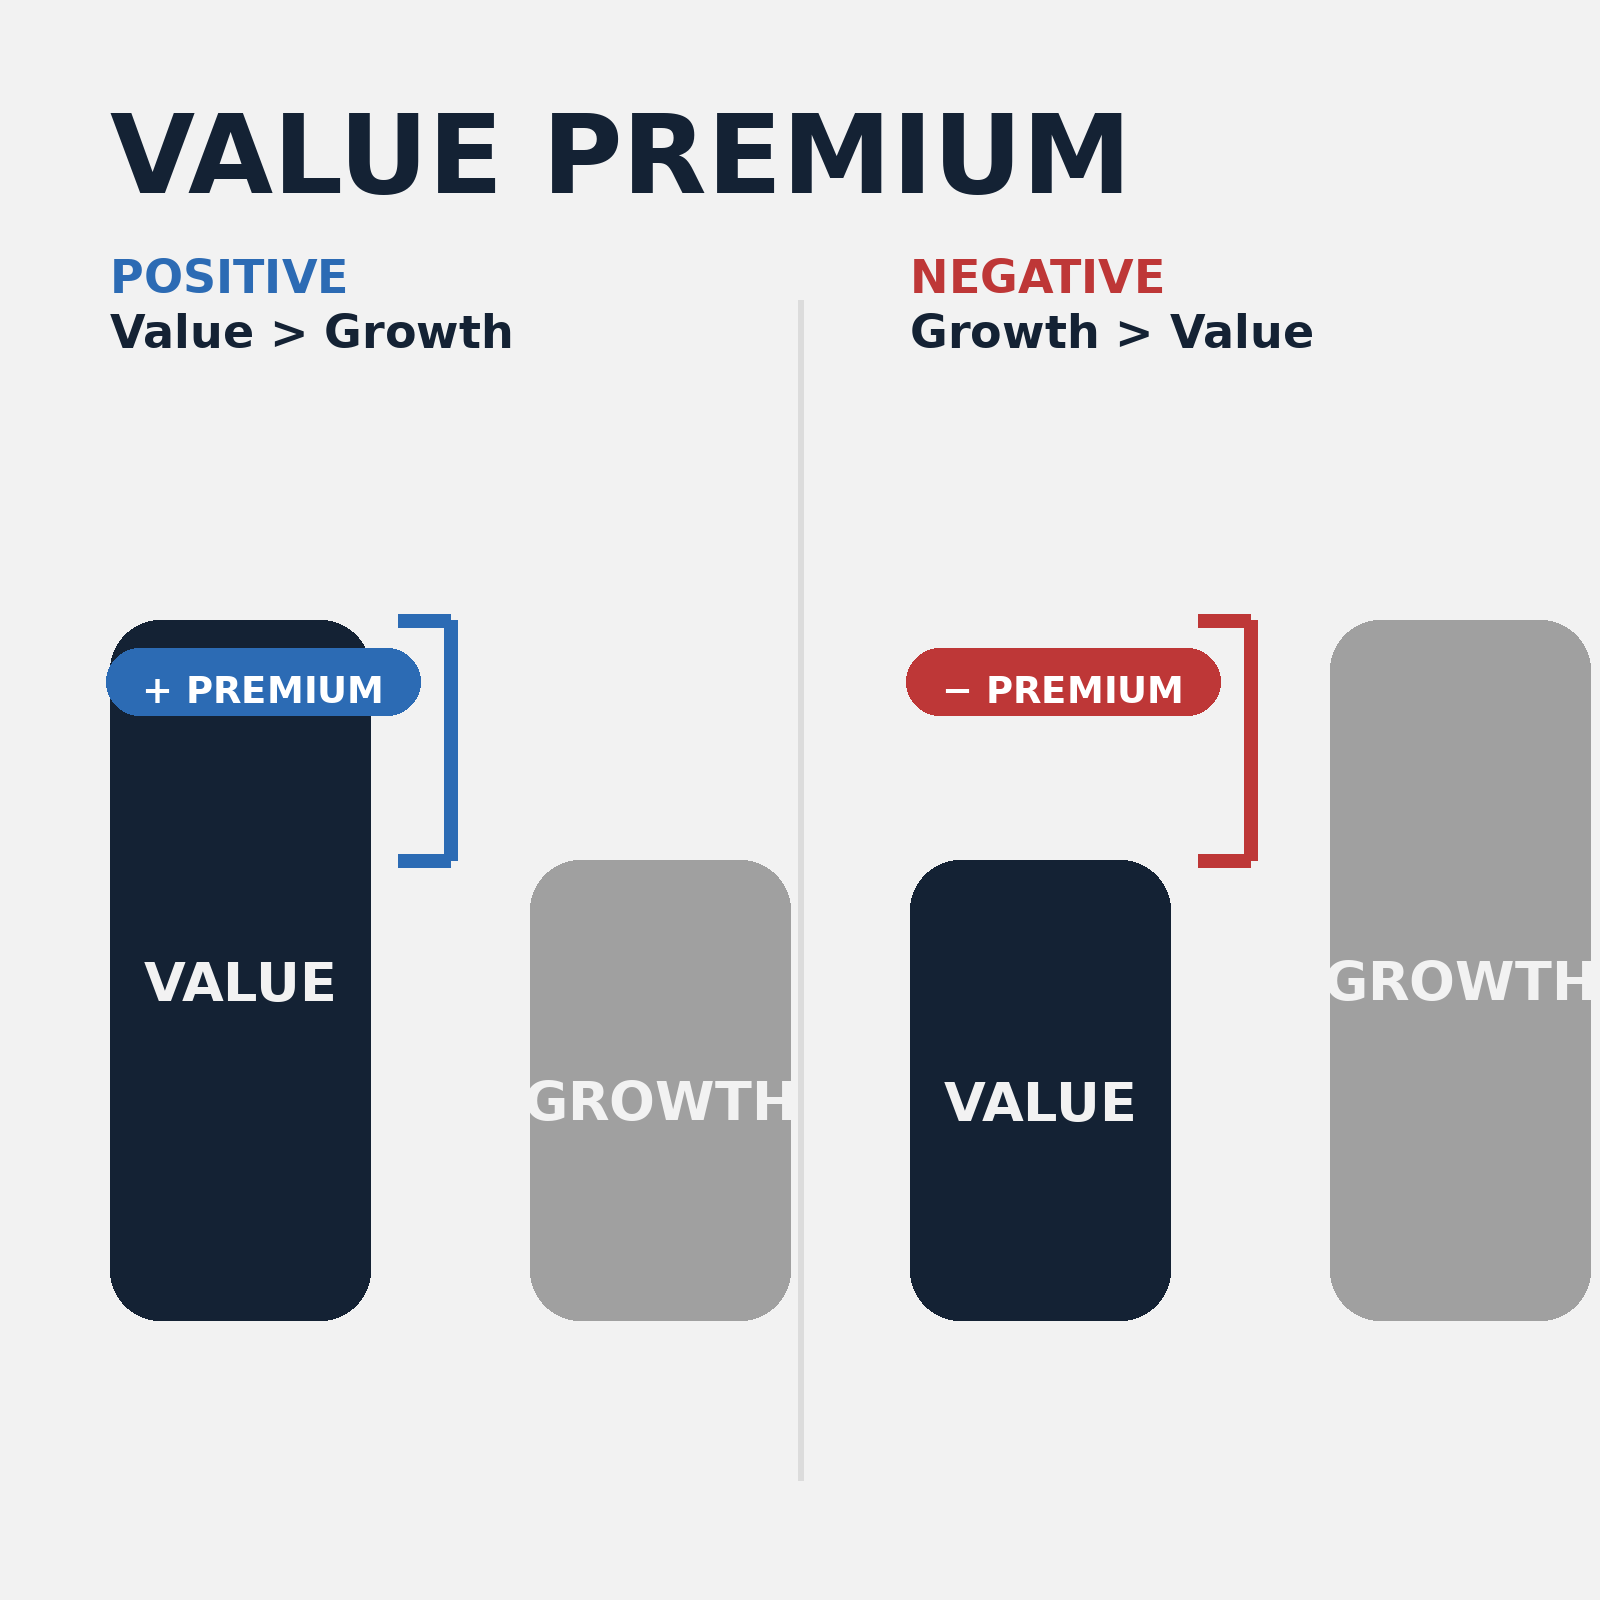
The Value Premium: Why ‘Cheap’ Stocks Have Tended to Win Long-term, but Why the Premium Often Feels ‘Dead’
Value is the tendency for cheap stocks, those trading on low valuations relative to fundamentals, to outperform expensive growth stocks over the long run. In the factor investing world, value is not a story first and a regression second. It is a portfolio idea: own the cheaper end of the market and underweight the priciest end, then accept the return pattern that comes with that positioning.
And that return pattern is the whole point. Value’s history is lumpy, with long stretches where it looks broken, followed by sharp recoveries that often arrive after investors have lost patience. That is why value is so hard to hold, because it can feel like you are wrong for years. Ironically, this is also why it can persist, either because it is genuinely riskier in the bad economic states that many investors fear, or because investors repeatedly overpay for glamour and underpay for dullness until expectations mean revert.


Good financial decisions aren’t about predicting the future, they’re about following a sound process today.
In investing, outcomes are noisy. Short-term performance often reflects randomness, not skill. Yet fund managers continue to pitch five-year track records as if they prove anything. They don’t.
As Ken French puts it, a five-year chart ‘tells you nothing’. The real skill lies in filtering out the noise, evaluating strategy, incentives, costs, and behavioural fit.
Don’t chase what worked recently. Stick with what works reliably.