Can Active Fund Managers Protect the Downside?
Active managers often insist that downside protection is the real benefit of their service. The promise is simple: when markets fall, they can reduce risk, shift to stronger sectors, hold cash, or sidestep disasters. That, they claim, is worth paying for.
But when we turn to the evidence, academic and empirical, the story changes. It turns out that downside protection is more marketing than reality.
In this post, we interrogate that claim using SPIVA (S&P Indices Versus Active Funds) scorecards for the most significant bear markets of the past 25 years: 2000–2002, 2008, 2011, 2018, 2020 and 2022. We also incorporate findings from Cochrane, Barras, Blake, Amihud, and others. The result is a robust test of the idea that active managers can reliably protect capital during market downturns.
‘Bear Market Myths’: SPIVA 2008
The SPIVA US Year-End 2008 report directly confronts the idea that bear markets are fertile ground for active management:
‘One of the most enduring investment myths is the belief that active management has a distinct advantage in bear markets… The downturn of 2008 provided another case study. The results are similar [to 2000–2002], with underperformance across all nine style boxes’ (S&P Dow Jones Indices 2009, 3).
To understand the depth of that underperformance, we begin with the earlier 2000–2002 bear market.
US Active Fund Underperformance by Style: 2000–2002
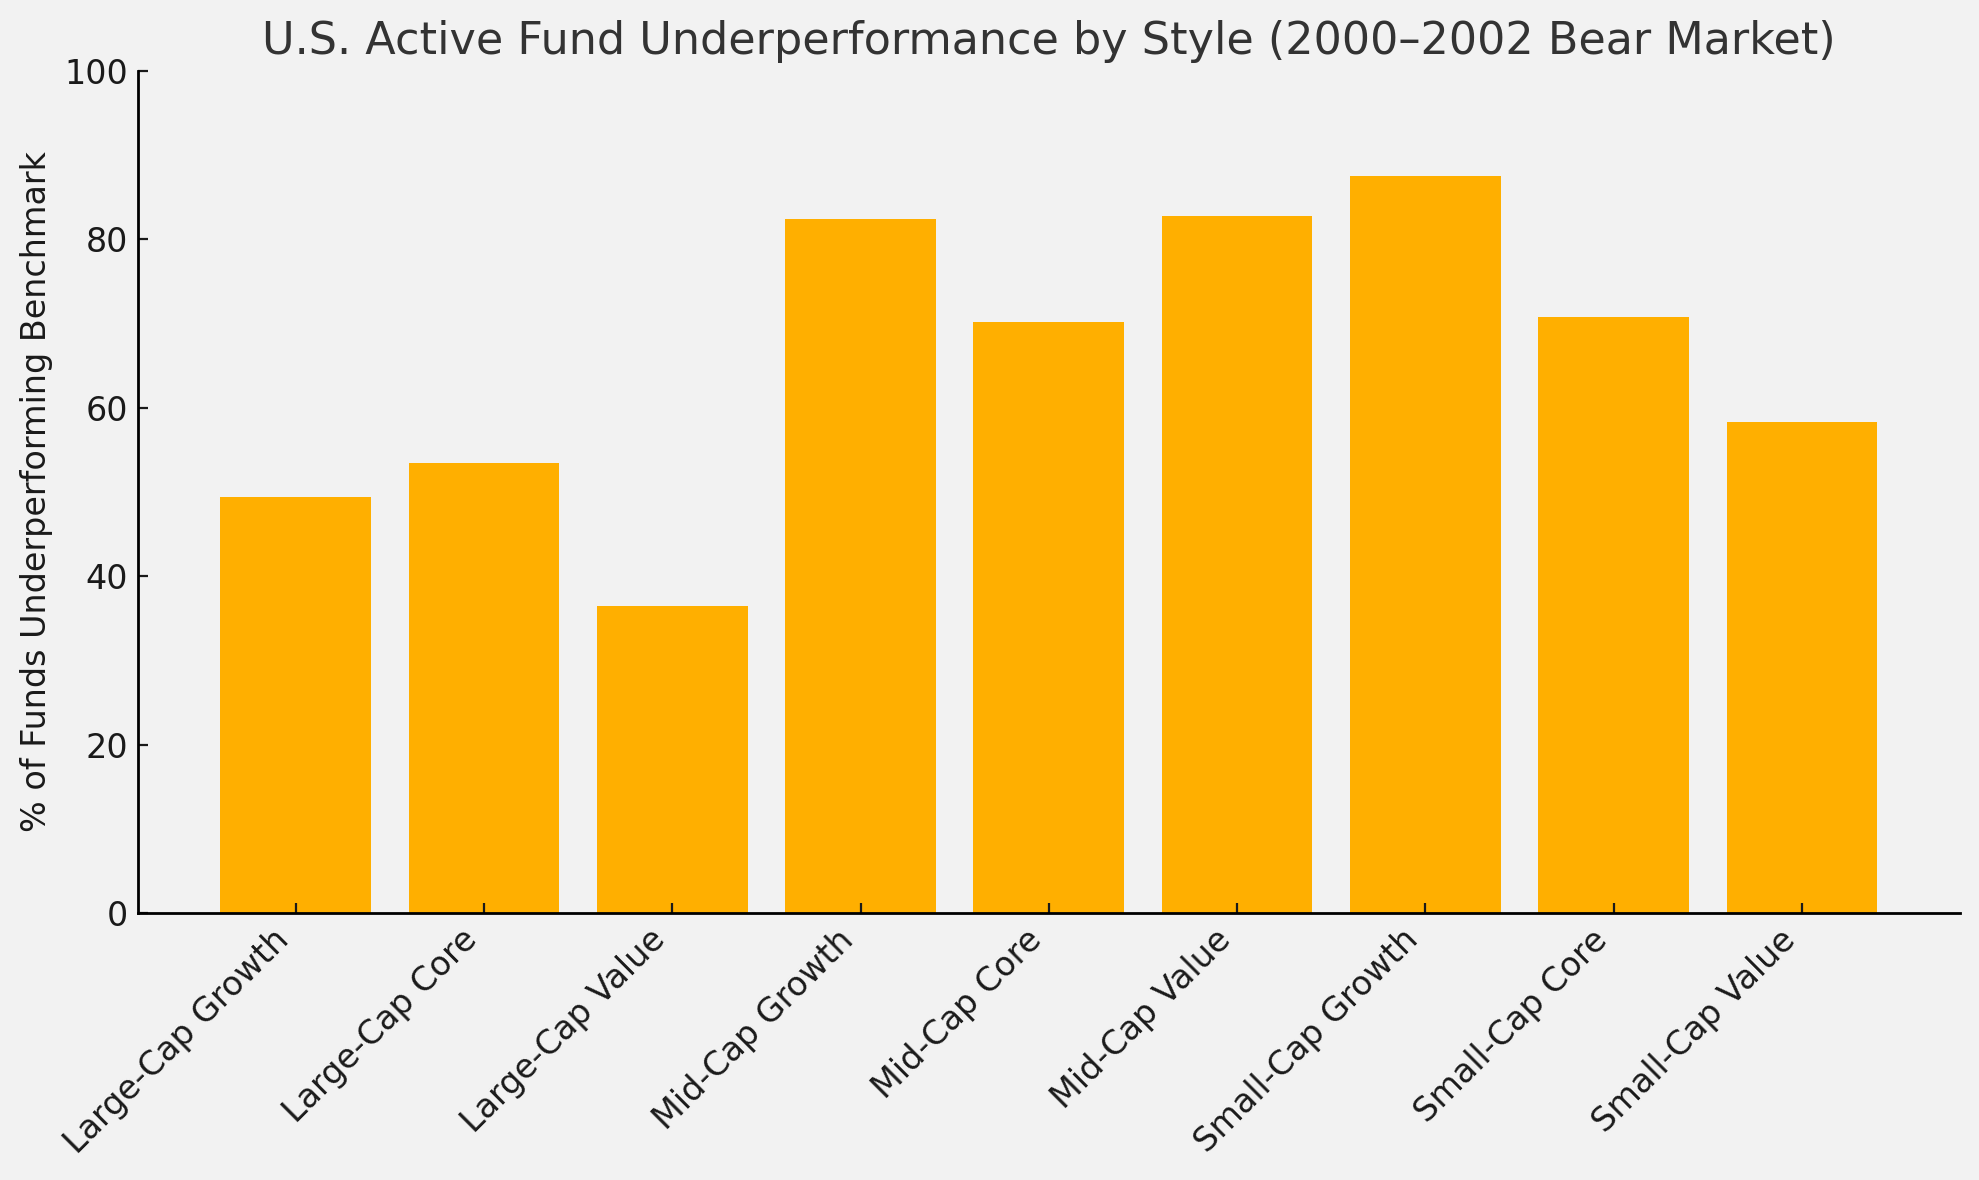
Figure 1. US Active Fund Underperformance by Style (2000-2002 Bear Market).
Small-cap growth: 87.5% underperformed
Mid-cap value: 82.8% underperformed
Large-cap value: relatively stronger, 36.5% underperformed
The narrative that skilled stockpickers shine during downturns is already looking shaky.
(SPIVA US Year-End 2008, p.3)
US Style Box Performance Across Downturns
Next, we examine performance across the major selloffs since 2000, including the Global Financial Crisis, Eurozone turbulence, COVID crash, and 2022’s rate-driven bear market. All nine style boxes are included: large, mid, and small; value, core, and growth.
US Active Fund Underperformance by Style and Year

Figure 2. US Multi-Year Style Box Chart.
(SPIVA US Scorecards, 2008–2022)
Consistently, active managers fail to deliver on the promise of downside protection:
Small-cap growth funds perform worst, with near-universal underperformance in multiple years.
Large-cap value holds up in 2008 and 2020, but fails again in 2022.
Even during 2020’s rapid crash-and-rebound, most style segments still lag their benchmarks.
If active management truly helped in downturns, these bars would be much shorter.
A Global Pattern: Different Markets, Same Story
Proponents often argue that the US is an unusually efficient market and that active managers fare better in international equities or small caps. To test that, we pulled SPIVA data for the UK, Europe, Japan and Australia across the same downturn years. Performance is broken out by large/mid and small-cap segments.
Active Fund Underperformance by Region, Style, and Year
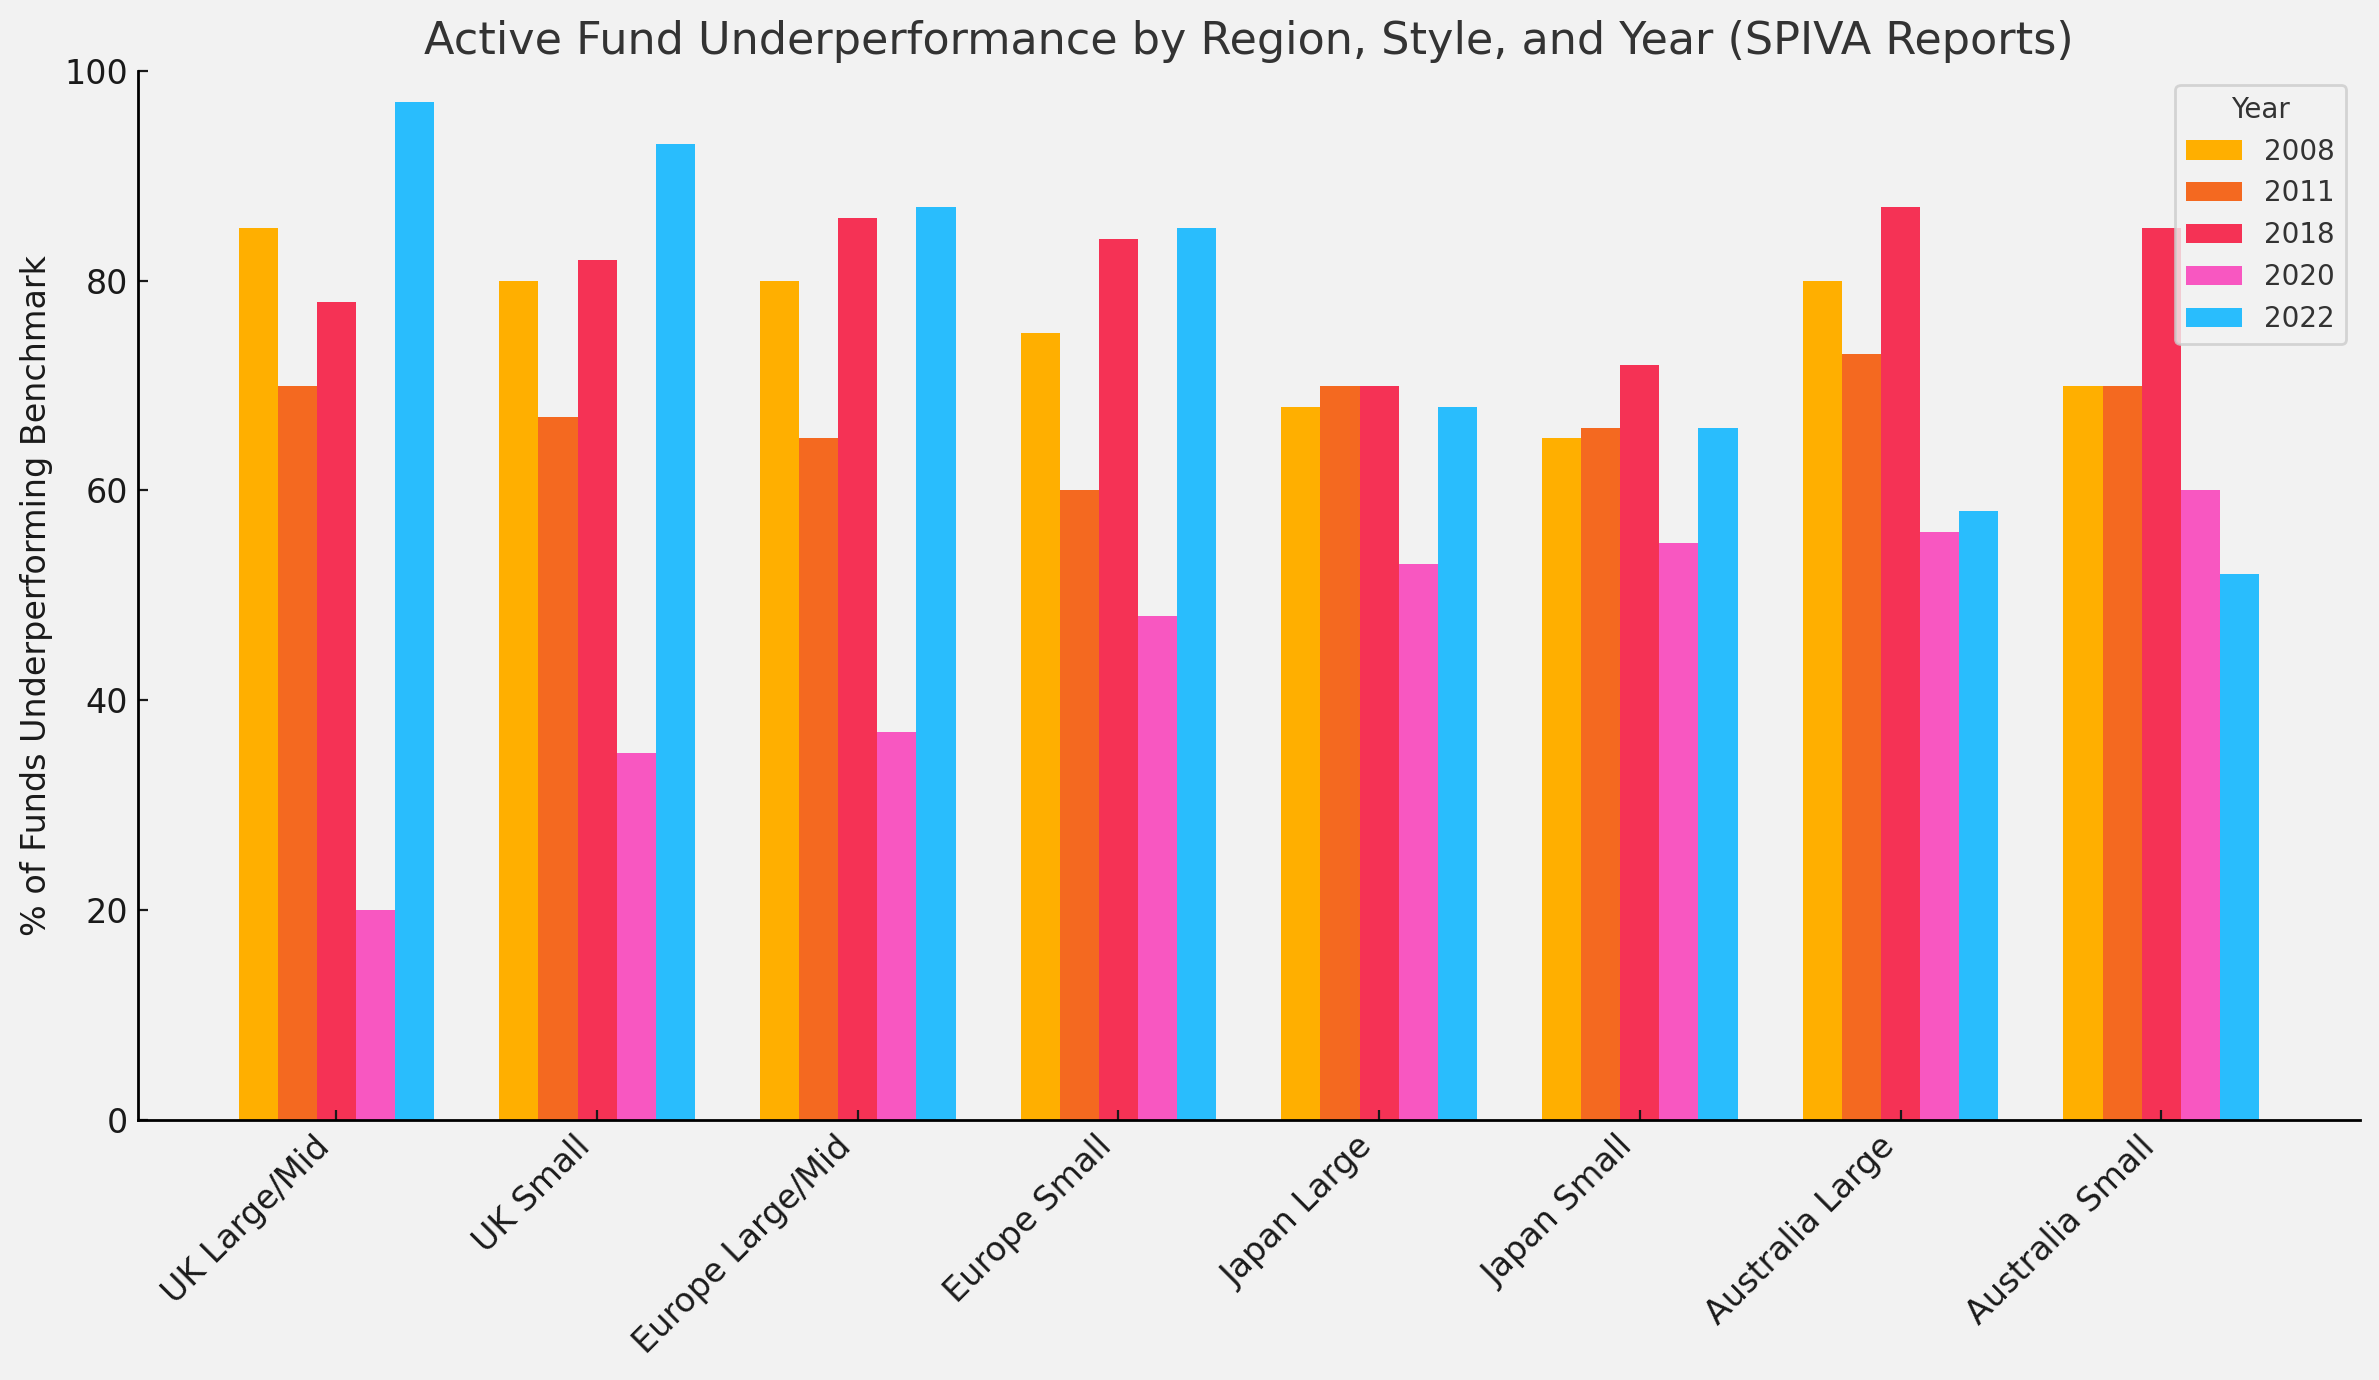
Figure 3. Global Multi-Region Chart.
(SPIVA Regional Scorecards, 2008–2022)
Key takeaways:
Small-cap funds do not consistently outperform, if anything, they often fare worse.
2020 is the only year with partial outperformance.
2022 sees catastrophic underperformance nearly everywhere, especially in large-cap equity funds.
This dismantles the argument that skilled managers simply need a ‘less efficient’ playground to succeed.
What Does the Academic Literature Say?
The academic record aligns with SPIVA’s findings:
Cochrane (2011) shows that stock price movements mainly reflect changes in expected returns, not fundamentals, making market timing near impossible.
Blake et al. (1993) report no evidence of superior performance among UK pension fund managers, even in recessions.
Barras, Scaillet and Wermers (2010) find that fewer than 1% of mutual funds deliver genuine, persistent alpha after adjusting for false positives.
Amihud and Goyenko (2013) show that R² (a measure of how closely a fund tracks its benchmark) is only weakly predictive of skill.
Cremers and Petajisto (2009) argue that high active share funds can outperform but only in rare cases, and not reliably in down markets.
Put simply, there is no persistent evidence that discretionary managers protect capital when it matters most.
When (If Ever) Does Active Work?
Let’s be fair: a few pockets exist where active strategies may help:
2020 saw some outperformance.
Certain factor-based strategies (e.g. low-volatility or quality) may systematically reduce downside risk (Blitz and van Vliet 2007).
Rules-based tactical allocation (like trend-following or managed futures) can manage tail risk, but these are niche and expensive.
Even then, these strategies are rare, and not representative of mainstream discretionary active funds.
Conclusion
SPIVA’s multi-decade dataset is clear: the idea that active fund managers consistently protect the downside is more myth than reality. Across style boxes, geographies, and crises, the numbers are damning.
‘The belief that bear markets favour active management is a myth’ (S&P Dow Jones Indices 2009, 3).
Investors hoping for protection in the next downturn may want to reconsider where they place their trust. Systematic, evidence-based strategies, not discretionary decision-making, remain the more reliable foundation for long-term portfolios.
References
Amihud, Yakov, and Ruslan Goyenko. 2013. ‘Mutual Fund’s R² as Predictor of Performance.’ Review of Financial Studies 26 (3): 667–94. https://doi.org/10.1093/rfs/hhs182
Barras, Laurent, Olivier Scaillet, and Russ Wermers. 2010. ‘False Discoveries in Mutual Fund Performance: Measuring Luck in Estimated Alphas.’ Journal of Finance 65 (1): 179–216. https://doi.org/10.1111/j.1540-6261.2009.01527.x
Blake, David, Bruce Lehmann, and Allan Timmermann. 1993. ‘Performance of UK Pension Fund Managers.’ Journal of Asset Management 4 (4): 225–38.
Blitz, David, and Pim van Vliet. 2007. ‘The Volatility Effect: Lower Risk without Lower Return.’ Journal of Portfolio Management 34 (1): 102–13. https://doi.org/10.3905/JPM.2007.698039
Cochrane, John H. 2011. Presidential Address: Discount Rates. Journal of Finance 66 (4): 1047–1108. https://doi.org/10.1111/j.1540-6261.2011.01671.x
Cremers, Martijn, and Antti Petajisto. 2009. ‘How Active Is Your Fund Manager? A New Measure That Predicts Performance.’ Review of Financial Studies 22 (9): 3329–65. https://doi.org/10.1093/rfs/hhp022
Kosowski, Robert, Allan Timmermann, Russ Wermers, and Halbert White. 2006. ‘Can Mutual Fund “Stars” Really Pick Stocks? New Evidence from a Bootstrap Analysis.’ Journal of Finance 61 (6): 2551–95. https://doi.org/10.1111/j.1540-6261.2006.01014.x
S&P Dow Jones Indices. 2009. S&P Indices Versus Active Funds Scorecard: Year-End 2008. https://www.spglobal.com/spdji/en/documents/spiva/spiva-us-year-end-2008.pdf
S&P Dow Jones Indices. Various Years. SPIVA Scorecards (US, UK, Europe, Japan, Australia). Accessed July 2025. https://www.spglobal.com/spdji/en/research-insights/spiva/