Factor Investing in Equities: An Evidence-Based Approach to Outperformance
Factor investing is a cornerstone of evidence-based portfolio construction, yet it’s often misunderstood or oversimplified. This post is deliberately in-depth because the topic deserves more than a passing glance, and it’s filled with valuable insights and empirical evidence.
At its core, factor investing is a systematic approach to building portfolios, designed to enhance risk-adjusted returns by targeting specific, academically validated sources of return. Unlike traditional active management, which often hinges on subjective forecasts and market timing, factor investing is grounded in decades of empirical research. It seeks to harvest persistent return premia, such as value, size, and profitability that have been extensively documented in the academic literature (Fama and French 1992, 2015).

What Are Factors?
Factors are the underlying characteristics that explain the differences in returns across securities. They can be broadly classified into two categories:
Macro Factors: These include broad economic drivers such as inflation, interest rates, and economic growth.
Style Factors: These are specific characteristics of assets, such as value, size, momentum, quality, and low volatility.
Stocks in different industries or regions can be sorted and grouped together based on their financial characteristics. The five main financial factors used in the Fama-French Five Factor (FF5) Model can be used to scientifically explain what drives investment returns in stocks. More specifically, the model can explain up to 95% of the differences in returns between two different diversified portfolios—the cross section of stock returns (Fama and French 2015). Whilst the FF5 model includes market, size, value, profitability, and investment, other well-documented factors, such as momentum, quality, and low volatility have also been shown to offer persistent risk premia and further enhance diversification.
The Most Common Factors, Including the Market Factor
The most widely recognised factors are rooted in decades of academic research. These include:
Market: The excess return of the market over the risk-free rate, as originally captured by the Capital Asset Pricing Model (CAPM). This remains a fundamental factor for explaining equity returns.
Value: Stocks that are undervalued relative to their fundamentals (e.g., low price-to-book ratios) tend to outperform.
Size: Smaller companies may offer higher long-term returns compared to larger firms. This factor is more pronounced combined with the value factor.
Profitability: Firms with higher profitability (measured by metrics like operating profits relative to assets) tend to offer superior returns.
Investment: Companies that reinvest conservatively and show lower asset growth generally outperform those with aggressive investment policies.
Momentum: Stocks with recent positive price momentum often continue to perform well in the short term.
Quality: Companies with strong balance sheets, high profitability, and stable earnings tend to outperform.
Low Volatility: Less volatile stocks have been found to deliver better risk-adjusted returns.

The Fama-French Model: A Cornerstone of Factor Investing (Fama and French 1992, 2015)
The concept of factor investing gained significant traction with the introduction of the Fama and French three-factor model in 1992. Eugene Fama and Kenneth French proposed that in addition to the market risk factor (captured by the CAPM), two other factors; size (small vs. large companies) and value (high vs. low book-to-market ratios), could explain a substantial portion of a stock's return. Later, they expanded the model to include the profitability and investment factors, forming the five-factor model.
The inclusion of profitability and investment addressed two critical aspects: firms with robust profitability metrics tend to perform better, whilst companies that grow their assets more conservatively also show stronger performance. The Fama-French five factors all have economic rationale and empirical evidence for a higher expected return.
The Strange Case of Momentum
Momentum is a key factor in explaining the cross section of stock returns, though it is not included in the FF5 model. It refers to the tendency of stocks that have performed well recently to continue outperforming in the short term, and vice versa for underperformers. Whilst the momentum premium is well-documented (Jegadeesh and Titman 1993), it lacks a strong theoretical risk-based explanation. This raises the possibility that its return premium could be arbitraged away as more investors seek to exploit it. In my view, this makes momentum a potentially useful, but less assured, source of long-term excess return.
Systematic vs. Discretionary Approaches (Ang 2014, Hale 2023)
Given my piece 'Strategic and Tactical Asset Allocation: A Recipe for Underperformance’, you will have noticed that ‘risk factors’ provide the opportunity to beat the market over the longer term, making factor investing a form of active management. Yet, I strongly advocate for a passive approach to investing. We need to rethink what we call an investment strategy that believes that ‘it’s all in the price’ but steps away from a market-cap weighted approach. For example, by including risk factor tilts, i.e., investing x% of the portfolio in (a) fund(s) targeting value or any other style factor. Perhaps a better approach is not to talk about ‘passive’ versus ‘active’ but to make the comparison between ‘systematic’ and ‘discretionary’ approaches (Hale 2023).
A systematic approach follows a defined set of rules executed in an objective and repeatable manner (Hale 2023). In such an approach, funds are not concerned about individual company names or qualitative, fundamental security analysis but focus on consistent quantitative characteristics (e.g., low price-to-book value for value stocks). These funds tend to hold a high number of stocks (sometimes in the thousands for a global equity product), with relatively low cost and turnover, managed in a disciplined and rules-driven manner. Index funds are a subset of systematic strategies.
By contrast, a discretionary approach involves managers using their judgement to determine whether companies or markets are overvalued or undervalued (Hale 2023). This often stems from the belief that markets have got prices wrong. Discretionary managers make decisions based on economic and geopolitical events that might affect the portfolio, reflecting a more judgemental and subjective investment style.
As we have seen from my previous pieces on the subject in parts one and two. Namely 'Can Active Fund Managers Consistently Outperform the Market?’ It is obvious that a systematic approach is vastly superior.
Why Factors Work (Asness, Moskowitz, and Pedersen 2013)
The persistence of factor premia can be attributed to two main reasons:
Risk-Based Explanations: Some factors represent a risk premium, compensating investors for bearing additional risk. For example, value stocks may be riskier than growth stocks because they often operate in mature or declining industries with weaker profitability, such as oil and gas, compared to growth firms in rapidly expanding sectors like artificial intelligence.
Behavioural Biases: Investors often exhibit predictable psychological biases, such as overconfidence, herding, or loss aversion, which can lead to systematic mispricing that factor strategies seek to exploit. For example, overly pessimistic sentiment can cause investors to undervalue out-of-favour value stocks, creating opportunities for disciplined value strategies to earn excess returns when prices mean-revert.
It does not necessarily matter why factors work, as the empirical evidence of factor premia is robust. However, it should be noted that theoretically, behavioural biases could be arbitraged away over time, potentially diminishing the effectiveness of certain factors (Asness, Moskowitz, and Pedersen 2013).
Smart Beta: A Practical Application (Ang 2014)
Factor investing often manifests in practical portfolios through smart beta strategies. Unlike traditional passive investing, which tracks market-cap-weighted indices, smart beta strategies create indices that tilt towards specific factors, like value or low volatility. These strategies aim to improve risk-adjusted returns whilst maintaining a rules-based, transparent approach.
Smart beta has become increasingly popular as it offers a middle ground between purely passive and active management, allowing investors to systematically pursue factor premia without relying on discretionary decision-making.
Implementing Factor Investing (Hou, Xue, and Zhang 2015)
Investors can implement factor-based strategies through various methods:
Factor Tilting: Adjusting portfolio weights to emphasise desired factors.
Smart Beta ETFs: Exchange-traded funds that systematically incorporate factor exposures.
Multi-Factor Strategies: Combining several factors to diversify and reduce specific risk.
Factor Premia

Figure 1. The chart displays the annual excess return of value stocks over growth stocks, known as the value premium or HML (High Minus Low), from 2000 to 2007. This was a period during which value stocks decisively outperformed growth stocks. This outperformance followed the burst of the dot-com bubble, as capital rotated away from highly priced tech and growth names into more attractively valued, fundamentally sound companies; many of which fell into the value category.
Over this eight-year stretch, and aside from 2007, the value premium was consistently positive, reflecting one of the most favourable environments for value strategies in recent decades. The cumulative return of the value premium during this period was approximately +106.6%, with a compound annual growth rate (CAGR) of 9.5%. Pretty sweet if you ask me.
In contrast, the market premium, defined as the return of the US market over the risk-free rate, had a negative cumulative return of −8.45% and a CAGR of −1.10% over the same period. This stark underperformance reflects the damage caused by the dot-com bust (2000–2002), which disproportionately impacted growth stocks and weighed heavily on the overall market.
The market used in this analysis is the US equity market, as defined by the Fama-French ‘Market’ factor, which includes all eligible NYSE, AMEX, and NASDAQ stocks in a value-weighted portfolio (essentially market-cap weighted).
Please see the ‘Chart References’ section at the bottom of this blog post for further information.
Persistence of Risk Premia
According to Felix (2020), ‘if we look at 10-year rolling periods with a one-month step interval for US stocks from July 1963 through April 2020, [size] SMB has been positive in 72% of rolling 10-year periods, [value] HML has been positive in 86% of 10-year rolling periods, [profitability] RMW has been positive in 86% of 10-year rolling periods, and the market has beaten treasury bills in 81% of rolling 10-year periods. Over 20-year periods the data are even more compelling.’
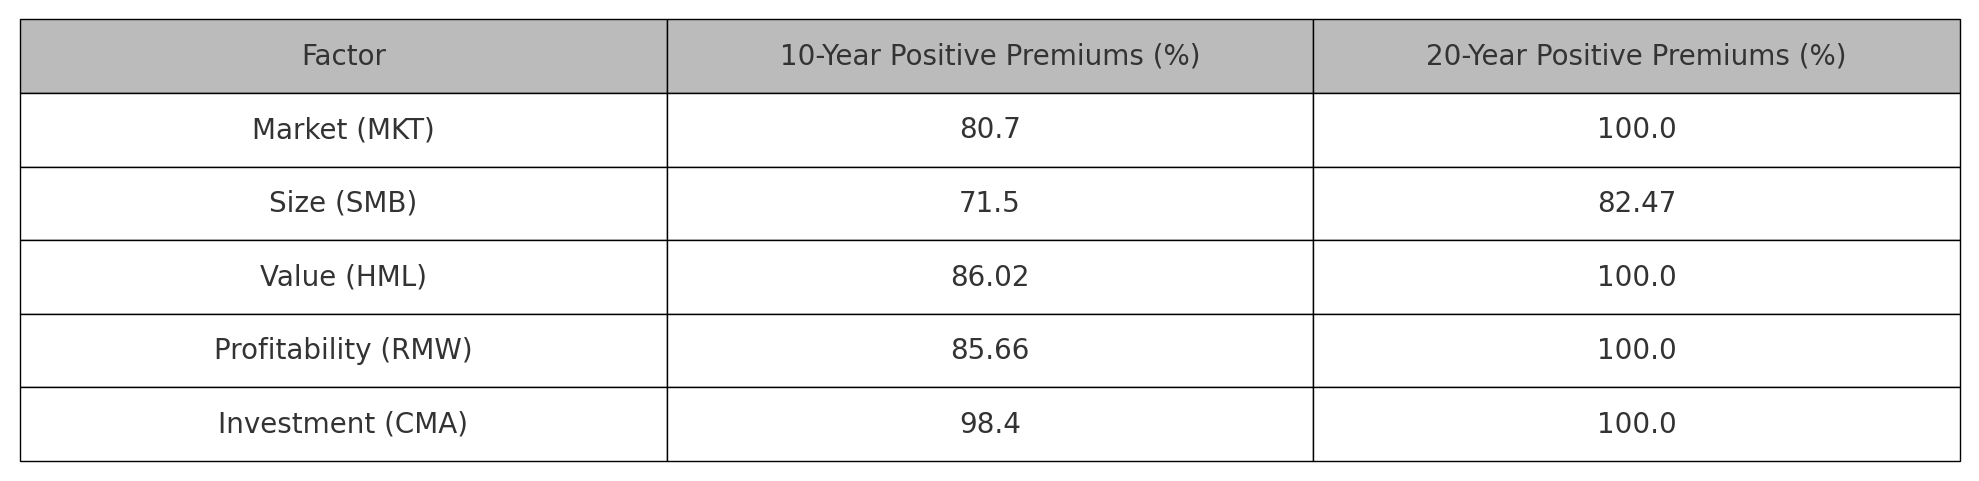
Persistence of US Academic Factor Premia. See Felix (2020).
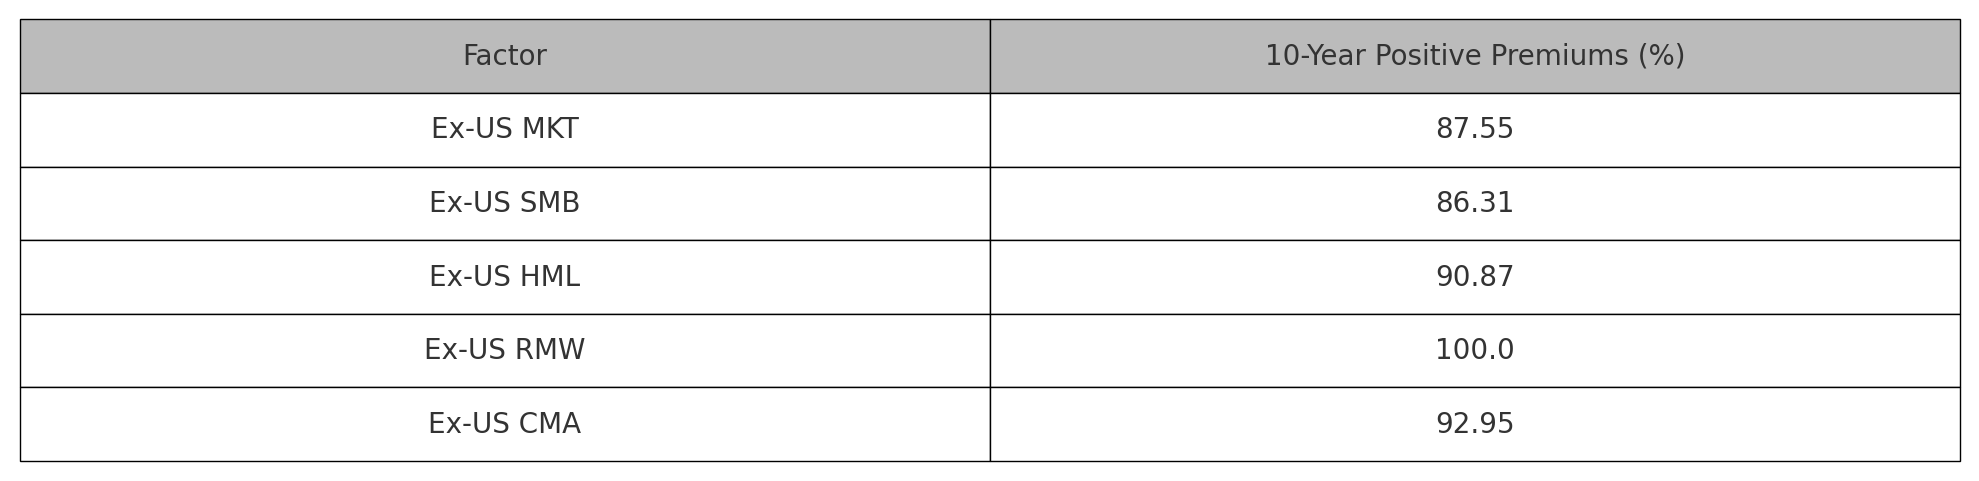
Persistence of ex-US Academic Factor Premia. See Felix (2020).
Challenges and Critiques
Whilst factor investing has gained popularity, it is not without its challenges. Factors can underperform for extended periods, and factor crowding can lead to valuation distortions. Moreover, data mining and overfitting remain risks when identifying new factors. Additionally, some critics argue that as more investors adopt factor-based strategies, the premia may diminish over time.
The Pitfalls of Factor Timing and the Case for Factor Diversification

Figure 2. The chart displays annualised returns from 1973 to 2024 for four prominent equity factors: Market, Value, Size, and Momentum. The data have been simulated to reflect realistic patterns based on long-term academic findings. Each factor exhibits cyclical performance, often behaving differently across market regimes. This visual underscores the rationale for multi-factor diversification rather than attempting to time individual factor performance.
Market represents the equity risk premium.
Value reflects the excess returns of cheap stocks (based on price-to-book or similar metrics) over expensive ones.
Size captures the historical premium of small-cap stocks over large-cap stocks.
Momentum measures the tendency for stocks with recent positive performance to continue outperforming in the short term.
Please see the ‘Chart References’ section at the bottom of this blog post for further information.

Here are the historical cumulative returns and CAGR from 1973 to 2024 based on Fama-French data. These results strongly support the case for long-term factor investing. Whilst there is substantial year-to-year variation, over five decades both the market and factors like momentum and value have delivered meaningful long-term excess returns. The path was volatile, but the reward has historically been there for those with the patience and conviction to stay the course.
The cumulative returns and CAGRs reported above represent the return spread between long and short portfolios, not the total return of a long-only factor fund.
But Hang on a Second…? Would It Not Have Been Better to Invest Solely in the US Equity Market?
Yes, if you could hold the market portfolio over five decades, unleveraged and without behavioural mistakes, it would have yielded the best risk-adjusted return among the individual factors shown.
But here’s why that conclusion is too simplistic:
Factors are not stand-alone investments.
You don’t typically invest only in Value or Size; you tilt a core market portfolio towards them. The idea is to blend them to improve diversification and enhance expected returns, not to replace the market entirely.
Diversification benefit.
These factors (especially Value and Momentum) have low correlations to each other and the market. A multi-factor portfolio (e.g. Market + Value + Momentum) would likely offer a smoother ride and better risk-adjusted returns, even if not the absolute highest CAGR.
Volatility and drawdowns.
The market’s return includes deep crashes (e.g. 1973–74, 2000–02, 2008–09, and March 2020). Factor exposures, especially Momentum and Quality, can reduce drawdowns and behavioural pressure.
Implementation matters.
Accessing the market cheaply only became widely available via index funds and ETFs in the last ~25 years. Before that, implementing factor tilts via disciplined models (especially by DFA, AQR, etc.) may have been more practical than truly market-cap-weighted investing.

Figure 3. The chart shows the compound growth of $1 invested from 1973 to 2024 in two portfolios—one tracking the US market and the other with a 20% tilt towards value stocks. Although the performance paths are nearly identical, the value-tilted portfolio ultimately lags slightly behind. This reflects the challenging period for value investing over the past 15 years, despite its historically positive premium.
Whilst the market portfolio (Mkt–RF) delivered the highest cumulative return over the full period, it’s important to recognise that it holds a significant allocation to growth stocks, which have historically underperformed value stocks in many long-term time periods. The value premium (HML) reflects the excess return of value over growth, and by tilting away from the market and towards value, investors can potentially enhance their long-term, risk-adjusted returns. Although muted in the recent decade and a half, the underlying rationale remains: by tilting away from growth and towards value, investors aim to improve long-term, risk-adjusted returns; not necessarily in every time period, but across many time periods.
This doesn’t mean abandoning the market, it means refining it systematically. A modest 20% tilt towards value, as illustrated in the chart, keeps broad diversification intact whilst positioning the portfolio to benefit when the value premium reasserts itself. And whilst value is used here as an example, similar tilts towards other empirically validated factors, like momentum, quality, or profitability, can also enhance portfolio efficiency over time.
Please see the ‘Chart References’ section at the bottom of this blog post for further information.

Figure 4. The chart displays the annual excess return of value stocks over growth stocks, known as the value premium or HML (High Minus Low), from 2008 to 2022.
This 15-year period was particularly challenging for value investing. The 2010s were dominated by growth stocks, as investors gravitated towards capital-light, high-growth businesses in a low-rate, tech-led market. Years such as 2008, 2011, 2014, 2015, 2019, and 2020 saw value significantly underperform growth, leading to persistent negative value premia.
A sharp reversal began in 2021, with the value premium rising to +22.2%, followed by an even stronger +31.7% in 2022, as inflation, interest rate hikes, and macroeconomic uncertainty triggered a rotation back into value-heavy sectors like energy, financials, and industrials.
Despite this late-cycle rebound, the cumulative return of the value premium over the full period was approximately −15.6%, with a compound annual growth rate (CAGR) of −1.13%. This stretch stands as a clear reminder that even well-documented return premia can face long, difficult cycles, making conviction and patience essential.
Such cyclical behaviour reinforces the importance of factor diversification and a disciplined, evidence-based approach, rather than relying on any single style or regime to deliver consistent outperformance.
Please see the ‘Chart References’ section at the bottom of this blog post for further information.

Figure 5. The chart above shows the Fama-French Momentum Premium UMD (Up Minus Down) from 2008 to 2022, representing the annual excess return of past winning stocks over past losers. Momentum investing, which involves going long on recent outperformers and short on underperformers, has historically delivered a positive premium, but its journey over this period was anything but smooth.
From 2008 to 2022 momentum delivered:
Cumulative return: −15.97%
Compound annual growth rate (CAGR): −1.15%
This confirms that, like value, momentum also experienced a difficult 15-year stretch and reinforces an important lesson for evidence-based investors: factor strategies require discipline, and chasing performance or abandoning a factor after underperformance can be costly. Momentum remains a valuable component of a diversified factor portfolio, but only when held with conviction and patience.
Please see the ‘Chart References’ section at the bottom of this blog post for further information.
To Summarise the Charts
Attempting to time factors, allocating capital dynamically to factors expected to outperform in the near term, is notoriously difficult. Just as with market timing, the challenge lies in forecasting short-term relative returns with enough consistency to overcome costs and behavioural pitfalls. Historical evidence suggests that even professional investors have struggled to time factors successfully.
Each factor—Value, Size, Profitability, Investment, Momentum, Quality, Low Volatility, has demonstrated long-term positive expected returns, but they tend to underperform over multiyear periods, often at different times. This low correlation in their relative performance is what makes diversifying across factors a powerful alternative to timing.
Illustration of Cyclical Factor Returns
Let’s briefly walk through the performance dynamics of some of the major equity factors:
Value: Tends to outperform during economic recoveries and when investor sentiment normalises. Struggled significantly in the 2010s but rebounded strongly post-2020.
Momentum: Does well during trending markets but often crashes during sharp regime changes (e.g. early 2009).
Size: Smaller stocks have tended to outperform over the very long term but can suffer in risk-averse environments.
Profitability & Quality: Often hold up better in economic downturns and when investors are seeking earnings resilience.
Investment (Conservative investment): Favours firms that invest cautiously. Can underperform when risk appetite is high.
Low Volatility: Favours defensive stocks, often outperforming during bear markets or high volatility environments.
Market (Beta): The baseline risk premium. Often dominates in bull markets, but loses ground in down markets when defensive or diversifying factors shine.
Incorporating Tim Hale’s Perspective (Hale 2023)
Tim Hale, in his book Smarter Investing: Simpler Decisions for Better Results, advocates for a disciplined, evidence-based approach to portfolio construction. Tim emphasises the importance of maintaining a systematic approach and cautions against making investment decisions based on recent trends or research alone. His philosophy aligns with the fundamental principles of factor investing, where maintaining consistency and adhering to a robust investment framework are paramount.
The Problem of Overweighting Recent Research (Harvey, Liu, and Zhu 2016)
There seems to be a tendency within the investment community to significantly overweight recent research relative to the cumulative body of past research. In some cases, this can lead to overly reactive portfolio changes based on the latest studies or trends (e.g., declaring minimum volatility as the optimal approach or claiming that bonds are obsolete in favour of 100% global equity).
Overemphasising recent findings can introduce instability into the investment process. Instead, recent research should be viewed as contributing to the cumulative stock of knowledge rather than completely supplanting it. The cumulative body of evidence should hold a greater relative weight than the latest paper, ensuring that long-standing, empirically supported factors are not discarded too hastily.
Conclusion
Factor investing represents a robust and evidence-based approach to enhancing portfolio returns. By focusing on systematic, research-backed factors, investors can potentially achieve better long-term outcomes compared to traditional market-cap-weighted strategies. However, patience and discipline are crucial, as factor premia can take years to materialise.
Fama-French Factor Methodology (Five Factors + Momentum)
Market (MKT – RF)
Definition: The return of the market portfolio minus the risk-free rate.
Method: Value-weighted return of all U.S. stocks (NYSE, AMEX, NASDAQ) minus the one-month T-bill rate.
Purpose: Captures the general equity risk premium.
Size (SMB – Small Minus Big)
Definition: Return of small-cap stocks minus large-cap stocks.
Method: Long a portfolio of small stocks, short a portfolio of large stocks, both value-weighted.
Purpose: Captures the size premium.
Value (HML – High Minus Low)
Definition: Return of value stocks minus growth stocks.
Method: Long stocks with high book-to-market ratios, short stocks with low book-to-market ratios.
Purpose: Captures the value premium.
Profitability (RMW – Robust Minus Weak)
Definition: Return of highly profitable firms minus weakly profitable firms.
Method: Long firms with robust operating profitability, short firms with weak profitability.
Purpose: Captures the profitability premium.
Investment (CMA – Conservative Minus Aggressive)
Definition: Return of low-investment firms minus high-investment firms.
Method: Long firms with conservative (low) asset growth, short firms with aggressive (high) investment.
Purpose: Captures the investment premium.
Momentum (UMD – Up Minus Down)
Definition: Return of past winners minus past losers.
Method: Long stocks with high returns over the past 12 months (excluding the most recent month), short stocks with low returns over the same period.
Purpose: Captures the momentum premium, based on price trend persistence.
References
Ang, A. 2014. Asset Management: A Systematic Approach to Factor Investing. Oxford University Press.
Asness, C. S., T. J. Moskowitz, and L. H. Pedersen. 2013. ‘Value and Momentum Everywhere’. The Journal of Finance 68 (3): 929–85.
Fama, E. F., and K. R. French. 1992. ‘The Cross-Section of Expected Stock Returns’. The Journal of Finance 47 (2): 427–65.
Fama, E. F., and K. R. French. 2015. ‘A Five-Factor Asset Pricing Model’. Journal of Financial Economics 116 (1): 1–22.
Felix, B. 2020. Five-Factor Investing with ETFs. Ottawa: PWL Capital. https://pwlcapital.com/wp-content/uploads/2024/08/Five-Factor-Investing-with-ETFs.pdf
Hale, T. 2023. Smarter Investing: Simpler Decisions for Better Results. 4th ed. FT Publishing International.
Harvey, C. R., Y. Liu, and H. Zhu. 2016. ‘… and the Cross-Section of Expected Returns’. The Review of Financial Studies 29 (1): 5–68.
Hou, K., C. Xue, and L. Zhang. 2015. ‘Digesting Anomalies: An Investment Approach’. The Review of Financial Studies 28 (3): 650–705.
Ilmanen, A. 2011. Expected Returns: An Investor’s Guide to Harvesting Market Rewards. Wiley.
Jegadeesh, N., and S. Titman. 1993. ‘Returns to Buying Winners and Selling Losers: Implications for Stock Market Efficiency’. Journal of Finance 48 (1): 65–91. https://doi.org/10.1111/j.1540-6261.1993.tb04702.x
Chart References
Asness, C. S., A. Frazzini, R. Israel, and T. J. Moskowitz. 2015. ‘Fact, Fiction, and Value Investing’. The Journal of Portfolio Management 42 (1): 34–52. https://doi.org/10.3905/jpm.2015.42.1.034
Fama, E. F., and K. R. French. 1992. ‘The Cross‐Section of Expected Stock Returns’. Journal of Finance 47 (2): 427–65. https://doi.org/10.1111/j.1540-6261.1992.tb04398.x
Fama, E. F., and K. R. French. 1993. ‘Common Risk Factors in the Returns on Stocks and Bonds’. Journal of Financial Economics 33 (1): 3–56. https://doi.org/10.1016/0304-405X(93)90023-5
Fama, E. F., and K. R. French. n.d. ‘Momentum Factor (UMD)’. Fama-French Data Library. Accessed May 21, 2025. https://mba.tuck.dartmouth.edu/pages/faculty/ken.french/data_library.html
Fama, E. F., and K. R. French. n.d. ‘U.S. Research Returns Data (2x3 Factors)’. Fama-French Data Library. Accessed May 21, 2025. https://mba.tuck.dartmouth.edu/pages/faculty/ken.french/data_library.html
Ilmanen, A. 2011. Expected Returns: An Investor’s Guide to Harvesting Market Rewards. Chichester: Wiley.
Jegadeesh, N., and S. Titman. 1993. ‘Returns to Buying Winners and Selling Losers: Implications for Stock Market Efficiency’. Journal of Finance 48 (1): 65–91. https://doi.org/10.1111/j.1540-6261.1993.tb04702.x