Private Assets: Evidence, Access and Implications for Investors
Introduction
Private markets now span a broad territory that includes buyouts, venture capital, private credit and private real estate, and they have expanded from niche corners of institutional portfolios into large and diverse ecosystems supported by specialist managers, intermediaries and a maturing secondary market. Enthusiasts often describe these assets as delivering higher returns with lower volatility and low correlations vis-à-vis the public markets, yet the reality is more subtle. Outcomes are mediated by the way returns are measured, the benchmarks chosen for comparison, the economics of fee and carry structures, and the extent to which reported numbers capture the underlying risks and costs that investors actually bear (Hendrix and Medhat 2024; Phalippou 2020). Scale is no longer in dispute, with industry sources placing private equity assets in the low tens of trillions of US dollars and projecting further growth, whilst private credit has risen rapidly to a level measured in the low trillions and has altered the structure of corporate lending in the middle market (S&P Global, n.d.; Hamilton Lane, n.d.; McKinsey 2024; Erel, Flanagan, and Weisbach 2024). The central question for investors is not whether private assets are large or popular, but whether, net of fees and after adjusting for risk and style, they improve portfolio outcomes in a way that is robust and realistically accessible.
What Are Private Assets
Private assets are investments in companies or projects that are not traded on public exchanges. Sometimes discussed under the broader heading of ‘shadow banking’, or more neutrally termed non-bank financial intermediation (NBFI), the label refers to credit intermediation and liquidity/maturity transformation that occurs outside the traditional banking system.
Private equity and private debt funds are typically organised as limited partnerships. The general partner (GP) manages the fund, makes investment decisions, and earns management fees and performance fees (carry). Limited partners (LPs) such as pension funds, endowments, and sovereign wealth funds commit capital for the GP to deploy on their behalf. These partnerships usually run for seven to ten years, with extensions common. Valuations are infrequent, often quarterly, and rely on self-reported net asset value appraisals rather than mark-to-market prices. Liquidity is limited. Together, these features make private assets quite different from the daily-priced, continuously tradable holdings that dominate most investors’ portfolios.
Across private assets, the GP almost always commits a small portion of capital to its own fund, typically about 1–5% of total commitments. The remainder comes from LPs such as pension funds, endowments, and insurers. Although modest in size, the GP’s commitment is symbolically powerful because it provides ‘skin in the game’ and helps align incentives. Without it, LPs might worry that GPs would be entirely insulated from losses and focused mainly on fee generation.
To evaluate and compare funds, practitioners group them by vintage year, which is the calendar year in which a fund begins deploying capital. Vintage years matter because they anchor performance to the market conditions and macroeconomic backdrop at the time of investment. A fund launched in 2008 faced very different opportunities and risks to one launched in 2021. Grouping by vintage enables fairer benchmarking by accounting for cyclical influences on returns.
LP commitments are not invested in one go. Instead, GPs call capital over several years as opportunities arise and later return capital through distributions when assets are realised or generate income. Steve Balaban of Mink Capital notes that this creates liquidity-management challenges for LPs, who must ensure cash is available when capital is called (Felix & Passmore, 2024). Large institutions often have systems to handle this, whilst newer investors such as family offices may struggle. They might pledge $100 million yet deploy only a fraction initially, leaving them to manage the remainder until called, sometimes on short notice. This can create a cash drag that does not show up in the fund’s reported results.
A final point concerns measurement. In private markets, performance can be expressed relative to committed capital (the total pledged) or invested, ‘paid-in’ capital (the amount actually deployed). Fees are often charged on commitments, whilst returns are calculated on invested capital. LPs can therefore pay fees on money not yet at work, and reported returns may reflect only the part of their total commitment that has been invested. Frequently, the ROI figure, often an IRR, does not incorporate uncalled capital. That is a favourable arrangement for GPs.

Private Equity
Private equity spans leveraged buyouts (LBOs), which acquire mature companies using a blend of debt and equity, and venture capital (VC), which finances early-stage firms with strong growth prospects. LBOs seek returns through operational improvements and financial structuring, whereas VC funding aims to catalyse innovation and rapid scaling.
Buyouts: Structure, Leverage and the Sources of Value
In a typical LBO, the PE firm provides a small equity stake, for example $20 million raised from LPs with a token GP co-investment, and borrows the remainder, say $80 million, from banks or bond investors. The debt is not borne by the PE firm itself but is placed on the target’s balance sheet. How is this possible? Practically, the PE firm forms a shell company that raises the $80 million and uses it to purchase the target. After purchase, the shell merges with the target so that the debt sits with the acquired business. From then on, the acquired company must service the loan, often at high interest rates, out of its own cash flows. This arrangement lets the PE firm control the company whilst limiting its capital at risk; if performance is strong, leverage magnifies returns on the modest equity stake, hence the term ‘leveraged buyout’.
The implications for the acquired company can be material. To meet debt obligations it may cut costs, reduce headcount and benefits, sell assets, or pare back investment in R&D and infrastructure. Some owners also extract value through monitoring fees or dividend recapitalisations, in which the company borrows more to pay cash to shareholders. If revenues weaken or conditions turn, the firm can struggle to service its debt, increasing the risk of default or insolvency, as seen with Toys ‘R’ Us.
Venture Capital: Skew, Dispersion and the Role of Governance
VC is different. It funds young companies that often lack meaningful revenue or profits, taking equity through staged rounds such as Seed, Series A, and Series B. Capital supports product development, hiring, and scaling. VC investors rarely assume full control; they back founders with strategic input, networks, and governance via board roles. The risk is high because many start-ups fail, yet a small number of successes can deliver large gains through trade sales or IPOs. VC is fundamentally about financing innovation and helping nascent businesses reach commercial viability.
An Overview
Headline private-equity returns, frequently cited in the mid-teens, are attractive, and GPs often present the asset class as a reliable source of superior long-term performance with diversification benefits. Caution is warranted, however. Reported outcomes are affected by managerial discretion and cash-flow timing, there are no observable market prices to anchor valuations, and volatility can be obscured. Performance is largely self-reported and can mask wide dispersion across funds. These features have underpinned private equity’s reputation as high return with low correlation; a later section examines whether that reputation holds after accounting for risk, fees, and factor exposures.
Private Credit: Definition, Growth and Underwriting Reality
Private credit, sometimes described as private debt from the borrower’s perspective, has grown materially since the Global Financial Crisis as banks have reduced their exposure to parts of the corporate lending market. Direct-lending funds now negotiate bilateral loans with mid-market borrowers and offer speed, certainty of execution and tailored documentation, which borrowers value. The investment case is often presented through headline yields in the region of 10 to 12 per cent and through histories of steady, low-volatility returns. Those features require careful interpretation because the loans are illiquid, covenants may be weaker than in earlier bank-dominated credit markets, and reported returns are appraisal-based and updated infrequently, which tends to mute volatility and correlation measures that are calculated from the reported series rather than from underlying economics (McGrath 2021; Hendrix and Medhat 2024). In addition, many portfolios contain explicit equity-like features, such as warrants or preferred equity, which complicate performance evaluation if comparisons are made only against investment-grade indices (Erel, Flanagan, and Weisbach 2024).
Fee Structures and Waterfalls
Cash outflows from the fund to stakeholders are typically subject to a tiered seniority or waterfall structure. Firstly, distributions go towards paying the GP’s management fee and servicing any debt. This can involve additional capital being called from LPs to pay the GP’s management fee. Secondly, distributions go towards returning the called capital back to the partners, which may include the GP. After that, LPs will receive all profits until they achieve a certain preferred return or hurdle rate (a hurdle rate of an IRR of around 8% is not uncommon).
Once LPs achieve their hurdle rate, the GP enters a catch-up tier, where they receive a majority share of profits (often 80-100%) until they achieve a predetermined share of total profits (carried interest). Finally, once the GP has completed catch-up, any additional profits are split pro-rata according to the carry percentage (e.g., with a 20% carry, each extra $1 is shared 80c to LPs and 20c to the GP).
The waterfall structure can be European (also known as global), where the LPs’ hurdle rate is at the fund level, or American (also known as deal-by-deal), where the hurdle rate is at the deal level. The latter is more favourable to the GP as it distributes carried interest faster. As the fund’s final return is only clear once all investments are sold, any profits paid to the GP above their original commitment are considered ‘carried’ and may be subject to clawbacks if later deals underperform.
The difference between European and American structures can be material for investor outcomes because earlier carry crystallisation and the timing of recycling affect how much of any gross return the limited partners actually retain over the life of the vehicle (Kaplan and Sensoy 2014). When representative numbers are put through these mechanics, it becomes clear that a gross return that looks comfortably into double digits can compress by several percentage points once management fees, transaction fees, operating expenses and carried interest have been accounted for, which is consistent with the capital-budgeting analysis that finds a large share of apparent rents accruing to managers rather than to investors (Erel, Flanagan, and Weisbach 2024; Gupta and Van Nieuwerburgh 2021).
Primaries and Secondaries
Most investors commit to primary funds at launch and then meet capital calls as deals are executed, with the fund life commonly set at ten years and extensions allowed to complete realisations. The secondary market provides a mechanism to reshape exposure before maturity by selling existing fund interests or by purchasing portfolios of positions, yet it should be thought of as conditional rather than as on-demand liquidity. Transactions require the general partner’s consent, involve substantial due-diligence and legal work, take months to close, and can be priced at discounts to reported net asset value when liquidity is most desired, which is often during market stress (Robinson and Sensoy 2015).
Performance Metrics: IRR, TVPI and Public Market Equivalent
Internal rate of return is a standard private-markets measure, but it is sensitive to the timing of cash flows and can be inflated by early realisations, so it does not translate well into a comparison with public markets that are priced and tradable daily (Phalippou 2020). Total value to paid-in capital answers a simpler question about how many times the contributed capital has grown, but even there the distribution of outcomes is wide. Using a large North American sample, the average multiple for private equity sits in a band that roughly spans 1.34 to 1.81, whilst the 5th to 95th percentile range extends from deeply disappointing outcomes to multiples above four, a spread that makes manager selection a dominant determinant of what investors actually earn (Hendrix and Medhat 2024). A more disciplined comparative tool is the Kaplan–Schoar public market equivalent, which discounts each fund cash flow at the total return of a chosen public index and assesses whether the private vehicle did better than making those same cash flows into the benchmark. Results are sensitive to the benchmark: buyout samples often show PME values of around 1.2 when the S&P 500 is used, but the premium tends to compress towards parity (1.0) when style-consistent comparators, such as small-cap or small-cap value indices, are chosen; venture capital looks very strong in the 1990s and more mixed thereafter, with results again dependent on benchmark choice (Harris, Jenkinson, and Kaplan 2012; Higson and Stucke 2012; Robinson and Sensoy 2015; Kaplan and Sensoy 2014; Hendrix and Medhat 2024; Phalippou 2020).
Benchmark Sensitivity and Net Outcomes
Once style is matched properly, much of the headline outperformance in private equity appears to diminish. Studies that compare net buyout cash flows to small-cap value proxies often find results close to parity, whilst venture results vary considerably by vintage and exhibit powerful cyclicality. A further observation is that carried interest is typically paid on absolute gains rather than on outperformance relative to public markets, which creates the possibility that investors pay performance fees even in scenarios where low-cost public exposures would have delivered similar outcomes after fees and risk (Phalippou 2020; Hendrix and Medhat 2024). These points do not imply that private vehicles cannot ever add value; rather, they locate the conditions under which value is most likely to be captured by investors, namely where fees are low, where access to genuine skill is realistic, and where portfolios are defined in a way that recognises true risk exposures.
Dispersion, Persistence and Access to Skill
Dispersion in private equity is materially larger than among public-equity managers, which means there is no practical way to secure the ‘market’ result other than by constructing a diversified book of commitments across managers, strategies and vintages. Evidence on persistence suggests that it is stronger in venture capital and weaker among top buyout funds after 2000, with some persistence of poor performance at the bottom end. The implications for the marginal investor are sobering: even if skill is present, it is difficult to guarantee access to it because successful funds are frequently oversubscribed and managers can either respond by rationing capacity or increasing fees to bring demand back to equilibrium; the competitive dynamics described by equilibrium models therefore reduce the odds that the average new pound will capture abnormal risk-adjusted excess returns (Berk and Green 2004; Harris et al. 2022).
With that being said, Mamdouh Medhat argues that once you adjust for survivorship bias, the apparent extra dispersion in private funds is probably overstated, and active public funds likely show about as much dispersion as private funds, especially over shorter horizons (Felix and Passmore 2025). More specifically, he said that: private funds do show very wide dispersion: the top 5% of funds in the asset classes they studied often double or triple invested capital after fees, whilst the bottom 5% can lose about half your money or more. However, comparing dispersion directly with public funds is tricky because poor public funds often disappear, so the surviving public-fund sample understates true dispersion of skill (Felix and Passmore 2025). Indeed, Medhat finds that for US-domiciled equity funds, the survival rate over the past 20 years was only about 45%, with an outperformance rate around 15%. His key conclusion was that if you look at public-fund returns over shorter periods, where survivorship bias is less severe, you ‘tend to see as much dispersion in the private space as you do in the public space’ (Felix and Passmore 2025).

Figure 1. Dispersion between top and bottom quartiles of private equity and public equity fund managers between the vintages of 2012-2021. Data taken from Meketa Capital (2024).
Factor Exposures and Diversification
When private-equity returns are regressed on standard public-market factors, the explanatory power is high for buyouts and noticeably lower for venture capital, which suggests that buyouts behave substantially like public equities with a particular risk tilt, whereas venture retains more variation that is not spanned by conventional factor models (Hendrix and Medhat 2024). This residual element is the foundation of a genuine diversification case for venture within an otherwise diversified portfolio. Private credit looks less correlated with standard fixed-income factors than investment-grade debt, but once equity-like features are acknowledged and documentation quality is considered, its behaviour aligns more closely with higher-yielding public credit than with defensive bonds, which limits its suitability as a direct substitute for high-quality fixed income (Hendrix and Medhat 2024; Erel, Flanagan, and Weisbach 2024).

Figure 2. This is a two-panel table from Hendrix & Medhat (2024) analysing quarterly net excess returns for a buyout private-equity series against Fama–French factors.
Panel A — Summary Statistics
Two samples are split: 1987Q4–2007Q4 and 2008Q1–2022Q4. For each, they show the mean excess return per quarter, volatility and t-statistics for:
Raw reported returns,
Unsmoothed returns (an AR(1) de-smoothing),
Fama/French US market excess return.
Pre-2008 the buyout series averages about 4.1% per quarter with volatility roughly 16–18% annualised and a strong t-stat. Post-2008 the mean is lower, about 2.6% per quarter, similar volatility to the market, and still statistically positive.
Panel B — Time-series Regressions (FF5)
They run Newey–West regressions of quarterly net excess returns on Mkt-RF, SMB, HML, RMW, CMA, with:
Lag 0 only,
Lags 0–3 (summing coefficients on the lagged returns to correct for smoothing),
Raw vs Unsmoothed series.
Pre-2008: Intercepts are large and statistically reliable, around 3.0–3.8% per quarter. Market beta is modest (~0.14–0.56). Other factor loadings are small, HML slightly negative, RMW mildly positive, CMA mildly negative. Adjusted R² is low (≈1–15%), so public-equity factors explain little of the variation.
Post-2008: Intercepts fall sharply to ~0.2–1.5% per quarter and lose significance once lags/unsmoothing are applied. Market beta rises (~0.45–0.78 depending on specification). Adjusted R² increases (~73–86%), so public market factors explain significantly more of the return variation in the modern era.
Key Findings: Panel A reports the average quarterly net excess return and volatility of private-equity buyout funds and the Fama/French US Market. Buyout is shown in two ways (as reported and ‘unsmoothed’) and in two eras. De-smoothing essentially allows for marking to market and reveals a ‘truer’ picture of returns in buyouts — the methodology is detailed in the research paper by Hendrix & Medhat (2024). Before 2008, average returns in buyouts were higher and volatility lower than the Fama/French US market, signalling large risk-adjusted excess returns for buyout funds. However, after fair-value accounting took hold in 2008, reported returns have tended to move more in line with public equity markets and excess risk-adjusted returns have largely dissipated.
Panel B regresses buyout funds’ quarterly net excess returns on the Fama–French five factors to see what portion is explained by broad, tradable risks; the numbers in brackets are t-statistics (rule of thumb: values around 2 or higher indicate statistical reliability at the 95% confidence interval). Pre-2008, the regressions have a very low adjusted R², meaning the factors explain little of the quarter-to-quarter variation, and the intercept (‘alpha’) is large — about 3–4% per quarter, with t-stats above 2. However, once you include return lags and especially when returns are de-smoothed, the intercept drops and the t-stats weaken, indicating that part of the apparent alpha was an artifact of smoothed valuations. Post-2008, the story reverses: the market factor loads strongly (betas roughly 0.45–0.80 with high t-stats), adjusted R² jumps into the 70–90% range, and the intercept shrinks to roughly 0–1½% per quarter with t-stats typically below 2, so it is not reliably different from zero. The other style factors (size, value, profitability, investment) add little economic or statistical power. In short, before 2008 buyout returns looked idiosyncratic and ‘alpha-heavy,’ but once fair-value marking and de-smoothing are applied, buyouts behave much more like equity-market exposure, and any residual alpha is small and statistically weak.
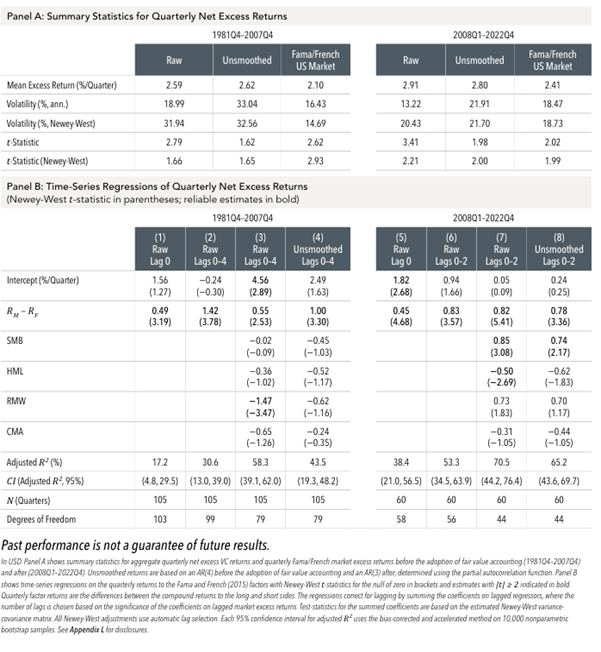
Figure 3: This is a two-panel table from Hendrix & Medhat (2024) that shows quarterly net excess returns for a VC private-equity series vs Fama–French factors.
Panel A — Summary Statistics
Two samples: 1981Q4–2007Q4 and 2008Q1–2022Q4. For each, they report mean excess return per quarter, volatility and t-statistics for:
Raw reported VC returns
Unsmoothed returns (AR de-smoothing)
Fama/French US market excess return
Pre-2008: Mean ≈ 2.6% per quarter (raw 2.59, unsmoothed 2.62) versus 2.10% per quarter for the market. Annualised volatility rises markedly when unsmoothed (~33% vs raw ~19%). T-stats drop with Newey–West corrections, indicating only modest statistical strength once serial correlation is addressed.
Post-2008: Mean ≈ 2.8–2.9% per quarter (raw 2.91, unsmoothed 2.80) vs the market at 2.41% per quarter. Unsmoothing again lifts volatility (to ~22% from raw ~13%). Newey–West t-stats are around ~2.0, so the average is positive but not overwhelmingly strong after accounting for dependence.
Reading: unsmoothing materially increases reported volatility in both eras, implying the raw series is smoothed.
Panel B — Time-series Regressions (FF5 with Newey–West)
They regress quarterly VC excess returns on Mkt−RF, SMB, HML, RMW, CMA using:
Lag 0 only
Lags 0–4 (summing lagged coefficients to handle smoothing)
Raw vs Unsmoothed series
Pre-2008 (1981Q4–2007Q4):
Intercepts: mixed. Lag-0 raw ≈ 1.56% per quarter (t-stat 1.27, not reliable). With lags on raw, one specification shows a large ~4.56% per quarter (t-stat 2.89), but after unsmoothing the intercept falls to ~2.49% per quarter (t-stat 1.63), losing reliability.
Market beta: 0.49–1.42 (all significant). Exposure rises when lag terms are included.
Other factors: small/counter-intuitive tilts: SMB ~0 to −0.45, HML ~−0.36 to −0.52, RMW notably negative in the raw-lags spec (−1.47, t −3.47), CMA mildly negative.
Fit: Adjusted R² ≈ 17–58% depending on specification.
Post-2008 (2008Q1–2022Q4):
Intercepts: 1.82%/qtr at lag-0 raw (t 2.68), but they shrink to ~0.05–0.24% and lose significance once lags and/or unsmoothing are applied.
Market beta: ~0.45–0.83 (significant) and ~0.78 with unsmoothed lags.
Other factors: clear equity style pattern — positive size (SMB ~0.74–0.85, significant), negative value (HML ~−0.50 to −0.62, significant/near-sig), modestly positive profitability (RMW ~0.70–0.73, weak), negative investment (CMA ~−0.31 to −0.44, weak).
Fit: Adjusted R² rises to ~38–71%, so public-equity factors explain much more of the variation in the modern era.
Key Findings: Panel A reports the average quarterly net excess return and volatility of venture-capital funds alongside the Fama/French US market. VC is shown two ways, ‘as reported’ and ‘unsmoothed’ and in two eras. As with buyouts, de-smoothing lifts measured volatility and strips out appraisal-based smoothing, giving a truer picture of risk. Before 2008, VC posted high average excess returns but with higher volatility than the public market, so the payoff looked attractive but bumpy. After 2008, once fair-value marking became standard, reported VC returns largely kept the same return but with significantly less volatility.
For venture capital, Panel B shows a tighter and more persistent link to public-market risks than in buyouts. Even before 2008 (1981–2007), VC returns load meaningfully on the market factor (betas ~0.5–1.4 with strong t-stats), and the model’s fit rises sharply once reporting lags are included (adjusted R² from ~17% to ~58%); the intercept is small or even negative in simpler specs, briefly large at about 4½% per quarter in the lagged ‘(b)’ column, then falls and weakens when returns are de-smoothed, which is consistent with appraisal smoothing. After 2008, market exposure remains strong and statistically tight, and the fit is high (adjusted R² ~40–70%). The intercept is small and usually not reliably different from zero, with the one higher estimate of 1.82% per quarter losing strength once lags or de-smoothed returns are used. Unlike buyouts, some style tilts matter for VC after 2008, especially ‘size’ (SMB), which is positive and significant, and ‘value’ (HML), which is negative, whilst profitability is large but statistically insignificant at the 95% confidence interval and investment is small and statistically insignificant. Overall, VC returns are largely explained by broad equity and size exposure, and any residual ‘alpha’ is modest and sensitive to lagging and de-smoothing.
Risk-Adjusting Private Credit
The way private credit is benchmarked has a decisive effect on the conclusions reached. Against broad investment-grade indices, performance can appear favourable, but once high-yield comparators are used and the equity-like components of cash flows are included in the discount rate, the apparent alpha narrows sharply or disappears. Empirical work that discounts distributions using both debt and equity factors finds risk-adjusted alphas that are economically small and statistically indistinguishable from zero on average, whilst methods that use only debt factors tend to produce a spurious positive result. It is also relevant that a meaningful minority of portfolios contain explicit equity features, which requires a broader performance frame than one that looks only at credit benchmarks (Hendrix and Medhat 2024; Erel, Flanagan, and Weisbach 2024).
Return Smoothing, Appraisal and Liquidity
Because private vehicles report valuations infrequently and use appraisal models, the resulting time series of returns understate the true economic volatility and produce correlations with public markets that are lower than would be measured if assets were marked continuously. Investors should therefore resist the temptation to equate smooth lines with safety. Liquidity planning has to be done at the whole-portfolio level: secondary markets help, but they are not a replacement for daily dealing, and they can be least accommodating at precisely the moments when liquidity is most valuable (Robinson and Sensoy 2015).
Access Routes for UK Investors
UK investors can access private assets through several channels. Listed private-equity investment trusts provide daily dealing in shares of vehicles that hold portfolios of fund commitments, co-investments and secondaries, but they can trade at sizeable discounts or premiums to net asset value because NAVs are updated infrequently and market sentiment moves faster than valuation marks. The trust structure adds a corporate layer and additional costs that need to be assessed in relation to the access it provides. Tax-advantaged schemes such as EIS, SEIS and VCTs channel capital to early-stage businesses; the reliefs compensate for illiquidity and failure risk, but manager due diligence, diversification by company and vintage, and strict adherence to qualifying rules and holding periods are essential. Long-Term Asset Funds are a UK-authorised route designed for illiquid assets with infrequent dealing and notice periods; operational due diligence is central because the product set is young and track records are still developing. Finally, some multi-asset funds include modest sleeves or listed proxies for private markets, which are convenient to hold but can behave differently from genuinely locked-up assets because public-market beta and discounts or premiums dominate short-term performance.
Governance, Pacing and Liquidity Management
Good outcomes in private markets rely on governance choices that are decided before capital is committed. Investors should understand the valuation policy, the independence and frequency of appraisals, the mechanics of the waterfall and catch-up, the possibility and process for clawback, the rules that govern cross-fund transactions, and the conditions under which secondaries may be used to reshape exposure. Commitment pacing should be planned deliberately so that capital calls can be met without disrupting other portfolio commitments, whilst vintage diversification helps manage cyclicality in deals and exits. In practice, these operational and governance details often matter as much as any headline return estimate because they determine how theoretical returns translate into cash that investors can spend.
Synthesis for Portfolio Construction
A disciplined approach treats private assets as potential complements rather than as wholesale replacements for public markets. Claims of outperformance should be tested with public market equivalent methods against style-consistent comparators, with appropriate factor adjustments where equity-like risks are present, and with explicit attention to gross-to-net leakage through fees and carry (Harris, Jenkinson, and Kaplan 2012; Hendrix and Medhat 2024; Phalippou 2020; Erel, Flanagan, and Weisbach 2024). The combination of wide dispersion, mixed evidence on persistence and constrained access to the most capable managers means that process and governance dominate. Buyouts behave substantially like equities with leverage and tilts; venture capital offers more distinct exposures and therefore a clearer diversification argument; private credit aligns more closely with high yield than with investment-grade bonds, which makes it an imperfect substitute for defensive fixed income.
Conclusion
Private assets expand the investable universe and can improve portfolios when they are used with clear objectives, realistic expectations and rigorous governance. They are not a shortcut to high returns with low risk. Measurement choices and benchmark selection matter, fees and carry have powerful effects on net outcomes, dispersion is wide and access to persistent skill is limited. A prudent policy integrates private assets as complements where they genuinely add to portfolio efficiency, backed by careful pacing, robust valuation oversight and an honest appraisal of liquidity.
References
Berk, Jonathan B., and Richard C. Green. 2004. ‘Mutual Fund Flows and Performance in Rational Markets’. Journal of Political Economy 112 (6): 1269–95. https://doi.org/10.1086/424739
Erel, Isil, Taylor Flanagan, and Michael S. Weisbach. 2024. ‘Risk-Adjusting the Returns to Private Debt Funds’. NBER Working Paper 32278. https://www.nber.org/papers/w32278
Felix, Ben, and Cameron Passmore. 2024. ‘Episode 305 – Is Private Credit Special?’ Rational Reminder [podcast]. https://rationalreminder.ca/podcast/305
Felix, Ben, and Cameron Passmore. 2025. ‘Episode 384 – Mamdouh Medhat: A Profitability Retrospective, and Private Fund Performance.’ Rational Reminder [podcast].
https://rationalreminder.ca/podcast/384
Gupta, Arpit, and Stijn Van Nieuwerburgh. 2021. ‘Valuing Private Equity Investments Strip by Strip’. Journal of Finance 76 (6): 3459–3506.
Hamilton Lane. n.d. ‘Truths Revealed: Private Markets Today’. Accessed 8 October 2025. https://www.hamiltonlane.com/en-us/insight/truths-revealed/private-markets-today
Harris, Robert S., Tim Jenkinson, and Steven N. Kaplan. 2012. ‘Private Equity Performance: What Do We Know?’ NBER Working Paper 17874. https://www.nber.org/papers/w17874
Harris, Robert S., Tim Jenkinson, Steven N. Kaplan, and Rüdiger Stucke. 2022. ‘Has Persistence Persisted in Private Equity? Evidence from Buyout and Venture Capital Funds’. SSRN Electronic Journal. https://doi.org/10.2139/ssrn.3736098
Hendrix, Kenneth, and Mamdouh Medhat. 2024. ‘Understanding Private Fund Performance’. Dimensional Fund Advisors. https://www.dimensional.com/ca-en/insights/understanding-private-fund-performance
Higson, Chris, and Rüdiger Stucke. 2012. ‘The Performance of Private Equity’. SSRN Electronic Journal. https://doi.org/10.2139/ssrn.2009067
International Monetary Fund. 2025. ‘Growth of Nonbanks Is Revealing New Financial Stability Risks’. IMF Blog, 14 October 2025. https://www.imf.org/en/Blogs/Articles/2025/10/14/growth-of-nonbanks-is-revealing-new-financial-stability-risks
Kaplan, Steven N., and Berk A. Sensoy. 2014. ‘Private Equity Performance: A Survey’. https://papers.ssrn.com/sol3/papers.cfm?abstract_id=2627312
Meketa Capital. 2024. ‘Why Manager Selection Is Critical When It Comes to Private Equity Investing.’ Research brief, November. Meketa Capital. https://meketacapital.com/wp-content/uploads/2024/12/MEKETA-CAPITAL_Performance-Dispersion-in-Private-Equity-2024.pdf
McGrath, Cameron. 2021. ‘Private Credit Shows Its Versatility as US Economy Bounces Back’. Preqin. https://www.preqin.com/insights/research/blogs/private-credit-shows-its-versatility-as-us-economy-bounces-back
McKinsey. 2024. ‘The Next Era of Private Credit’. https://www.mckinsey.com/industries/private-capital/our-insights/the-next-era-of-private-credit
Phalippou, Ludovic. 2020. ‘An Inconvenient Fact: Private Equity Returns & The Billionaire Factory’. https://papers.ssrn.com/sol3/papers.cfm?abstract_id=3623820
Price, Chris, and Joseph Warrington. 2025. ‘Fears Rise over $3trillion Shadow Banking Crisis’. The Telegraph, 10 October 2025. https://www.telegraph.co.uk/business/2025/10/10/fears-rise-over-3trillion-shadow-banking-crisis/
Robinson, David T., and Berk A. Sensoy. 2015. ‘Cyclicality, Performance Measurement, and Cash Flow Liquidity in Private Equity’. SSRN Electronic Journal. https://doi.org/10.2139/ssrn.1731603
S&P Global. n.d. ‘Private Markets’. Accessed 8 October 2025. https://www.spglobal.com/en/research-insights/market-insights/private-markets
Yahoo Finance. 2025. ‘Blue Owl Chief Looks to Bank Loans for Dimon Cockroaches’. https://finance.yahoo.com/video/blue-owl-chief-looks-bank-120539134.html