The Size Premium Myth? Why Small May Need Friends
The ‘size premium’, the notion that small-capitalisation shares deliver higher returns than their larger peers, has been a fixture of finance since Banz (1981). The intuition is straightforward: smaller companies are riskier and less liquid, so investors might reasonably expect a higher reward for owning them. Yet decades after Banz, the evidence is mixed. The small-cap story depends on horizon, region, and whether we control for other effects such as value or profitability. This post asks whether size earns a premium in its own right, or only when paired with other tilts.
Historical Evidence
Over the longest horizons, small caps have often delivered higher absolute returns. In the United States, the annualised size premium from 1926 to 2022 is commonly quoted at roughly 1.7 per cent (Cordischi 2023). In sterling terms, the UK evidence is even starker: since 1955 the Numis Smaller Companies Index has outpaced large caps by around 3.3 percentage points a year, turning £1,000 in 1955 into roughly £9 million by 2022 with dividends reinvested, versus ~£1 million for large caps (Marsh and Evans 2020). Across developed markets, the picture is more muted. Research Affiliates estimate a post-1981 average closer to 1 per cent and frequently not statistically significant outside the US (Kalesnik and Beck 2014).
In Japan, several practitioner and academic series suggest Japanese small caps have modestly outperformed large caps since the early 2000s, on the order of 1½–2 percentage points per year (SuMi Trust 2021). The overall message: small caps have often done better than large caps in absolute terms, but the spread is neither uniform across markets nor stable across decades.
Cyclicality and Inconsistency
The size premium is notoriously cyclical. In the US, much of the outperformance arrived in two bursts, the 1940s and the mid-1970s to mid-1980s, when small stocks surged (Stevenson 2025). Excluding such episodes, Edward McQuarrie argues the advantage to holding small caps largely disappears for long stretches (Stevenson 2025). More recently, mega-cap technology leadership has left small caps trailing; for example, from 2016 to 2023 UK small caps underperformed the FTSE All-Share by almost 20 percentage points (Stevenson 2025).
Statistically, the effect is fragile. The long-run US premium is influenced by a few extreme rebound years (e.g., 1933). Adjusting for delisting bias, higher trading costs, and non-normality weakens the case further; outside the US, conventional significance tests are seldom passed (Kalesnik and Beck 2014).
Size on Its Own?
Whilst small caps have outperformed in an absolute sense, the evidence that size alone delivers a risk-adjusted premium is weak (Dimson, Marsh, and Staunton 2002). Cliff Asness has gone further, arguing that much of the apparent outperformance can be explained by small stocks carrying higher market betas. Once you scale their returns for this greater exposure to the equity market, ‘you really don’t find any size effect—zippo, nada’ (Asness, cited in Kalesnik and Beck 2014). In other words, small firms may not earn anything over and above what one would expect simply from taking on more market risk.
Where size does appear more meaningful is in combination with other effects. The value premium is particularly strong among small stocks: small-value firms have dramatically outperformed small-growth firms, whereas among large caps the value–growth spread is narrower (Fama and French 2012). Small-growth companies, by contrast, are frequent laggards.
Quality matters too. Small firms are more likely to be unprofitable or financially fragile. Asness, Frazzini, Israel, Moskowitz, and Pedersen (2015) show that once you control for ‘junk’, excluding low-quality small caps, the size premium becomes significant and more stable through time. In practice, small high-quality companies have consistently beaten large high-quality companies. The implication is that size is less a standalone reward than a magnifier of other premia.
Hale’s Perspective
Tim Hale reaches a similar conclusion: over the long run and across geographies, smaller companies have tended to outperform larger ones, yet since Banz (1981) the premium has looked statistically weak; meanwhile, value and profitability ‘seem to work better’ within small caps. Even so, Tim argues a case for inclusion remains based on higher absolute-return potential as compensation for risk, diversification benefits, and the fact that other premia are often stronger in small caps (Hale 2023).

Figure 1. The scatter plots compare the average monthly excess returns (portfolio returns minus the risk-free rate) of the 25 size–value portfolios (constructed by Fama and French) with their estimated market betas from July 1990 to June 2025. Each dot represents a portfolio. For example, US small-cap growth or ex-US large-cap value and the dashed lines are the Security Market Lines (SMLs) implied by the Capital Asset Pricing Model. The SML is simply the line we would expect if market beta alone explained returns: portfolios with higher betas should lie above those with lower betas, with a slope equal to the average market excess return (market return minus the risk-free rate).
How to Interpret
Small-cap growth stocks are consistently disappointing. In both the US and developed ex-US, they sit well below the Security Market Line. Their realised returns are too low given their betas, leading to poor Sharpe ratios.
Small-cap value stocks, by contrast, shine. They lie comfortably above the SML in both regions, earning far more than would be predicted by beta alone.
Large-cap portfolios tell a more muted story. US large-cap growth is well above the line, whilst ex-US large-cap growth is well below. Large-cap value tends to sit slightly above it for both regions, though not nearly to the same extent as their small-cap cousins.
The Security Market Lines themselves have similar slopes for US and ex-US data, reflecting broadly comparable average market excess returns. But the scatter around the lines is telling: beta clearly does not capture all cross-sectional variation in returns. In other words, the CAPM looks to be an incomplete asset pricing model, as is often referenced in the financial literature.
Why It Matters
These charts bring to life what decades of asset-pricing research has found:
Beta is not the whole story. CAPM predicts a neat linear relationship, but the data show persistent deviations.
The value effect is visible across regions, particularly in small stocks.
The crucial point relating to the much-debated size effect is that it is not a simple premium in its own right. Small-cap growth is weak; the strength lies in the combination of small and value.
For investors, this underlines why multi-factor approaches (like Fama–French three-factor or five-factor models) have become more widely accepted than a pure CAPM framework.
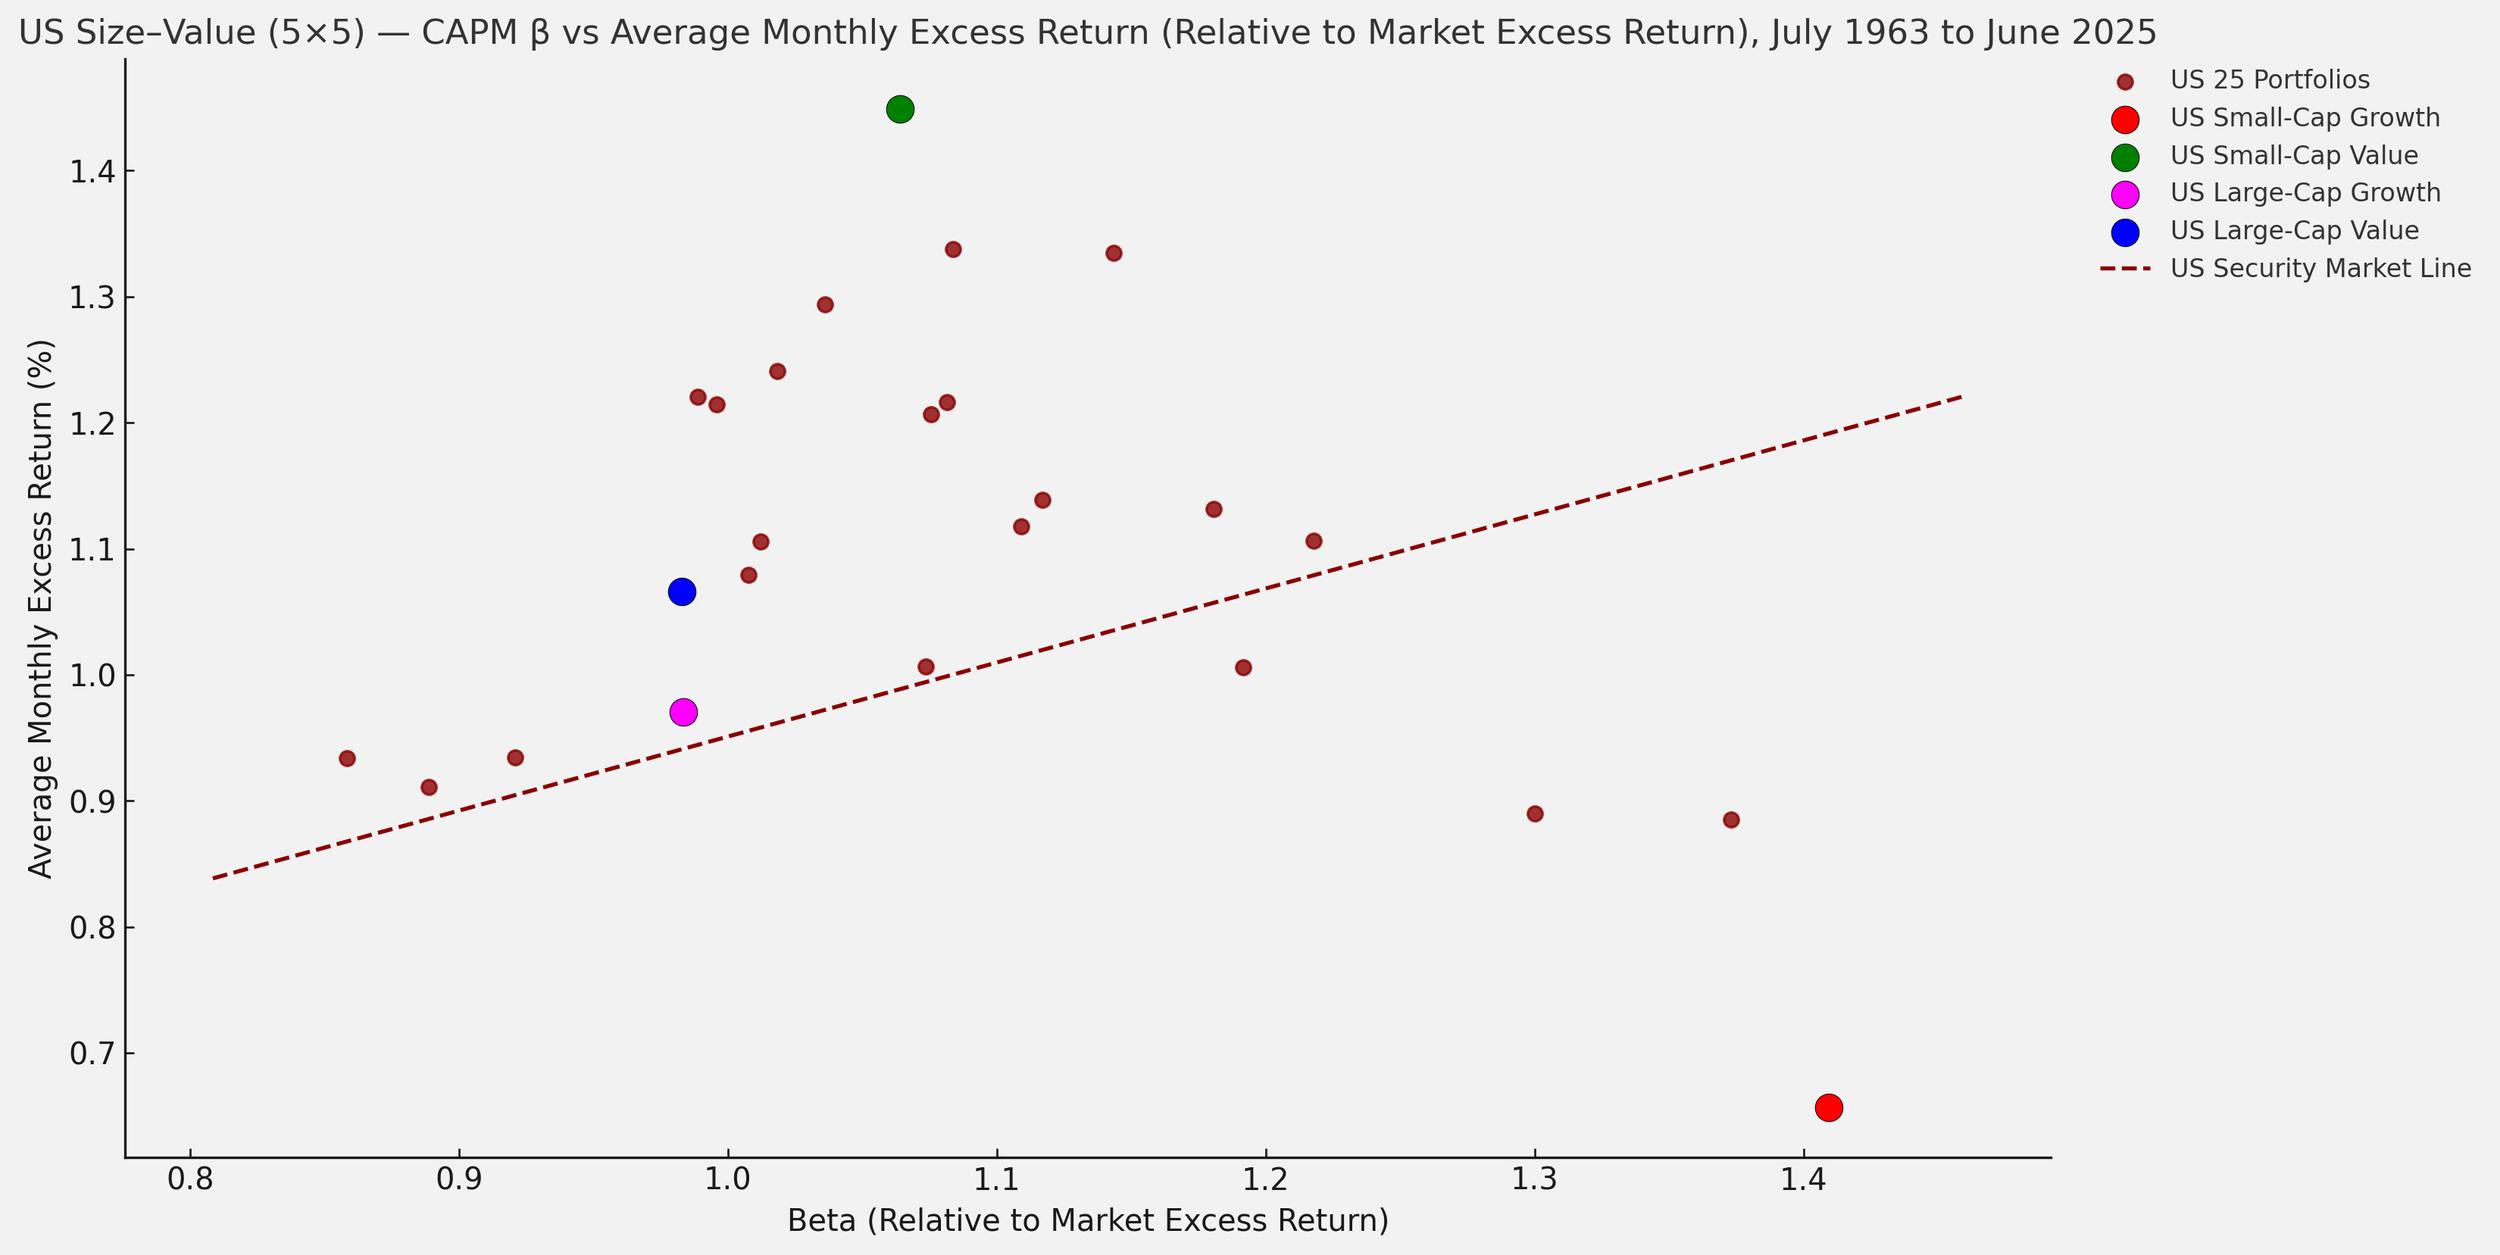
Figure 2. The chart plots the average monthly excess returns of the 25 US size–value portfolios against their market betas, from July 1963 to June 2025. Each red circle represents a portfolio, whilst the dashed line shows the Security Market Line implied by CAPM.
The highlighted points tell the story:
US small-cap value stocks (green) sit clearly above the line, earning much higher returns than their betas would predict.
US small-cap growth stocks (red) fall well below it, delivering poor returns for their level of risk.
Among large caps, value (blue) earns a modest premium above the line, whilst growth (magenta) hovers close to or just below it.

Figure 3. The chart shows the cumulative growth of $1 invested in the size premium (SMB factor) and the market factor (Mkt–RF), for both the US and developed ex-US markets, from July 1990 to June 2025.
The two dashed lines represent the market excess return factors. A dollar invested in the US market (in excess of the risk-free rate) has grown more strongly, reaching over six times its initial value, whilst the developed ex-US market has delivered lower but still positive growth, roughly tripling over the same period. This reflects the long-run outperformance of US equities relative to other developed markets.
The solid lines show the size premium (SMB: small minus big stocks). Here the picture is very different. Both in the US and ex-US data, a dollar invested in the SMB factor has delivered little to no growth over 35 years. In fact, the US SMB factor has trended slightly downwards since the mid-2000s, while the ex-US SMB factor has oscillated around flat.
What This Means
The market premium has been robust across regions—stronger in the US, but visible ex-US too.
The size premium on its own has not delivered: small stocks as a group have not outperformed large stocks consistently, especially in the US where the SMB factor has been negative for longer.
This reinforces the earlier point from the CAPM scatter plots: the ‘size effect’ is not a stand-alone source of return. It is most effective when combined with value, as small-cap value portfolios show clear outperformance relative to both CAPM predictions and other style groups.
Portfolio Implications
Don’t rely on size alone for ‘free’ outperformance. A pure small-cap index tilt is unlikely to deliver a robust risk-adjusted edge. Expect at best a modest incremental return with higher volatility and meaningful implementation frictions.
Combine size with other tilts. The stronger evidence lies in small-cap value and small-cap quality. Many systematic strategies explicitly target these intersections, either by requiring profitability (e.g., index eligibility rules) or by weighting more heavily towards cheaper, higher-quality small companies (Fama and French 2012; Asness et al. 2015).
Diversification still matters. Small caps widen the investable universe—roughly a tenth of global market capitalisation and add sectoral, geographic, and business-model breadth that large-cap-only portfolios miss. Correlations are high but imperfect, so there is still a diversification benefit at the margin.
Implementation is critical. Not all small-cap funds are created equal. Index design choices (e.g., S&P SmallCap 600’s profitability screen vs Russell 2000’s broader coverage) and systematic fund rules (e.g., excluding unprofitable small-growth names, using patient trading to reduce impact) can materially affect realised returns and risks (Asness et al. 2015; Hale 2023). Choose vehicles that capture the ‘useful’ parts of the small-cap universe rather than paying for extra noise.
Be patient. Any size-related payoff accrues slowly and irregularly. Dry spells can run for years, sometimes decades, before sharp mean-reversion bursts. A small-cap tilt suits long-term, disciplined investors prepared to rebalance into relative weakness.
Conclusion
The weight of evidence suggests that the size premium is not robust in isolation. It has delivered higher absolute returns but with little statistical significance on a risk-adjusted basis. Where size earns its keep is in combination with value and profitability, premia that are stronger among smaller companies. For long-term investors, small caps remain a useful building block: they broaden diversification, enhance factor tilts, and provide exposure to a different slice of the market. Just don’t expect size alone to outperform on a risk-adjusted basis.
References
Asness, Clifford S., Andrea Frazzini, Ronen Israel, Tobias J. Moskowitz, and Lasse H. Pedersen. 2015. ‘Size Matters, If You Control Your Junk’. Journal of Financial Economics 116 (3): 449–472.
Banz, Rolf W. 1981. ‘The Relationship between Return and Market Value of Common Stocks’. Journal of Financial Economics 9 (1): 3–18.
Cordischi, Enrico. 2023. ‘The Small-Cap Premium—Down but Not Out’. World Finance, 24 May.
Dimson, Elroy, Paul Marsh, and Mike Staunton. 2002. Triumph of the Optimists—101 Years of Global Investment Returns. Princeton: Princeton University Press.
Fama, Eugene F., and Kenneth R. French. 2012. ‘Size, Value, and Momentum in International Stock Returns’. Journal of Financial Economics 105 (3): 457–472.
French, Kenneth R. n.d. Data Library. Dartmouth College, Tuck School of Business. Accessed September 18, 2025. https://mba.tuck.dartmouth.edu/pages/faculty/ken.french/data_library.html
Hale, T. 2023. Smarter Investing: Simpler Decisions for Better Results. 4th ed. FT Publishing International.
Kalesnik, Vitali, and Noah Beck. 2014. ‘Busting the Myth about Size’. Research Affiliates Fundamentals.
Marsh, Paul, and Scott Evans. 2020. 65 Years of the Numis Smaller Companies Index. London Business School and Numis.
Stevenson, David. 2025. ‘Small Caps: Still Worth a Place in Portfolios?’ ShareScope Blog, February.
SuMi Trust. 2021. Resurrection of Small Caps. Tokyo: Sumitomo Mitsui Trust.