The Value Premium: Why ‘Cheap’ Stocks Have Tended to Win Long-term, but Why the Premium Often Feels ‘Dead’
The value premium is the historical tendency for ‘value’ stocks, shares that trade at low prices relative to fundamentals, to outperform ‘growth’ stocks, shares priced on high multiples and optimistic expectations. In the academic factor framework, this idea is most commonly proxied by the Fama–French value factor, HML (‘High minus Low’), built from diversified portfolios of cheap stocks minus expensive stocks (Fama and French 1992; Fama and French 1993).
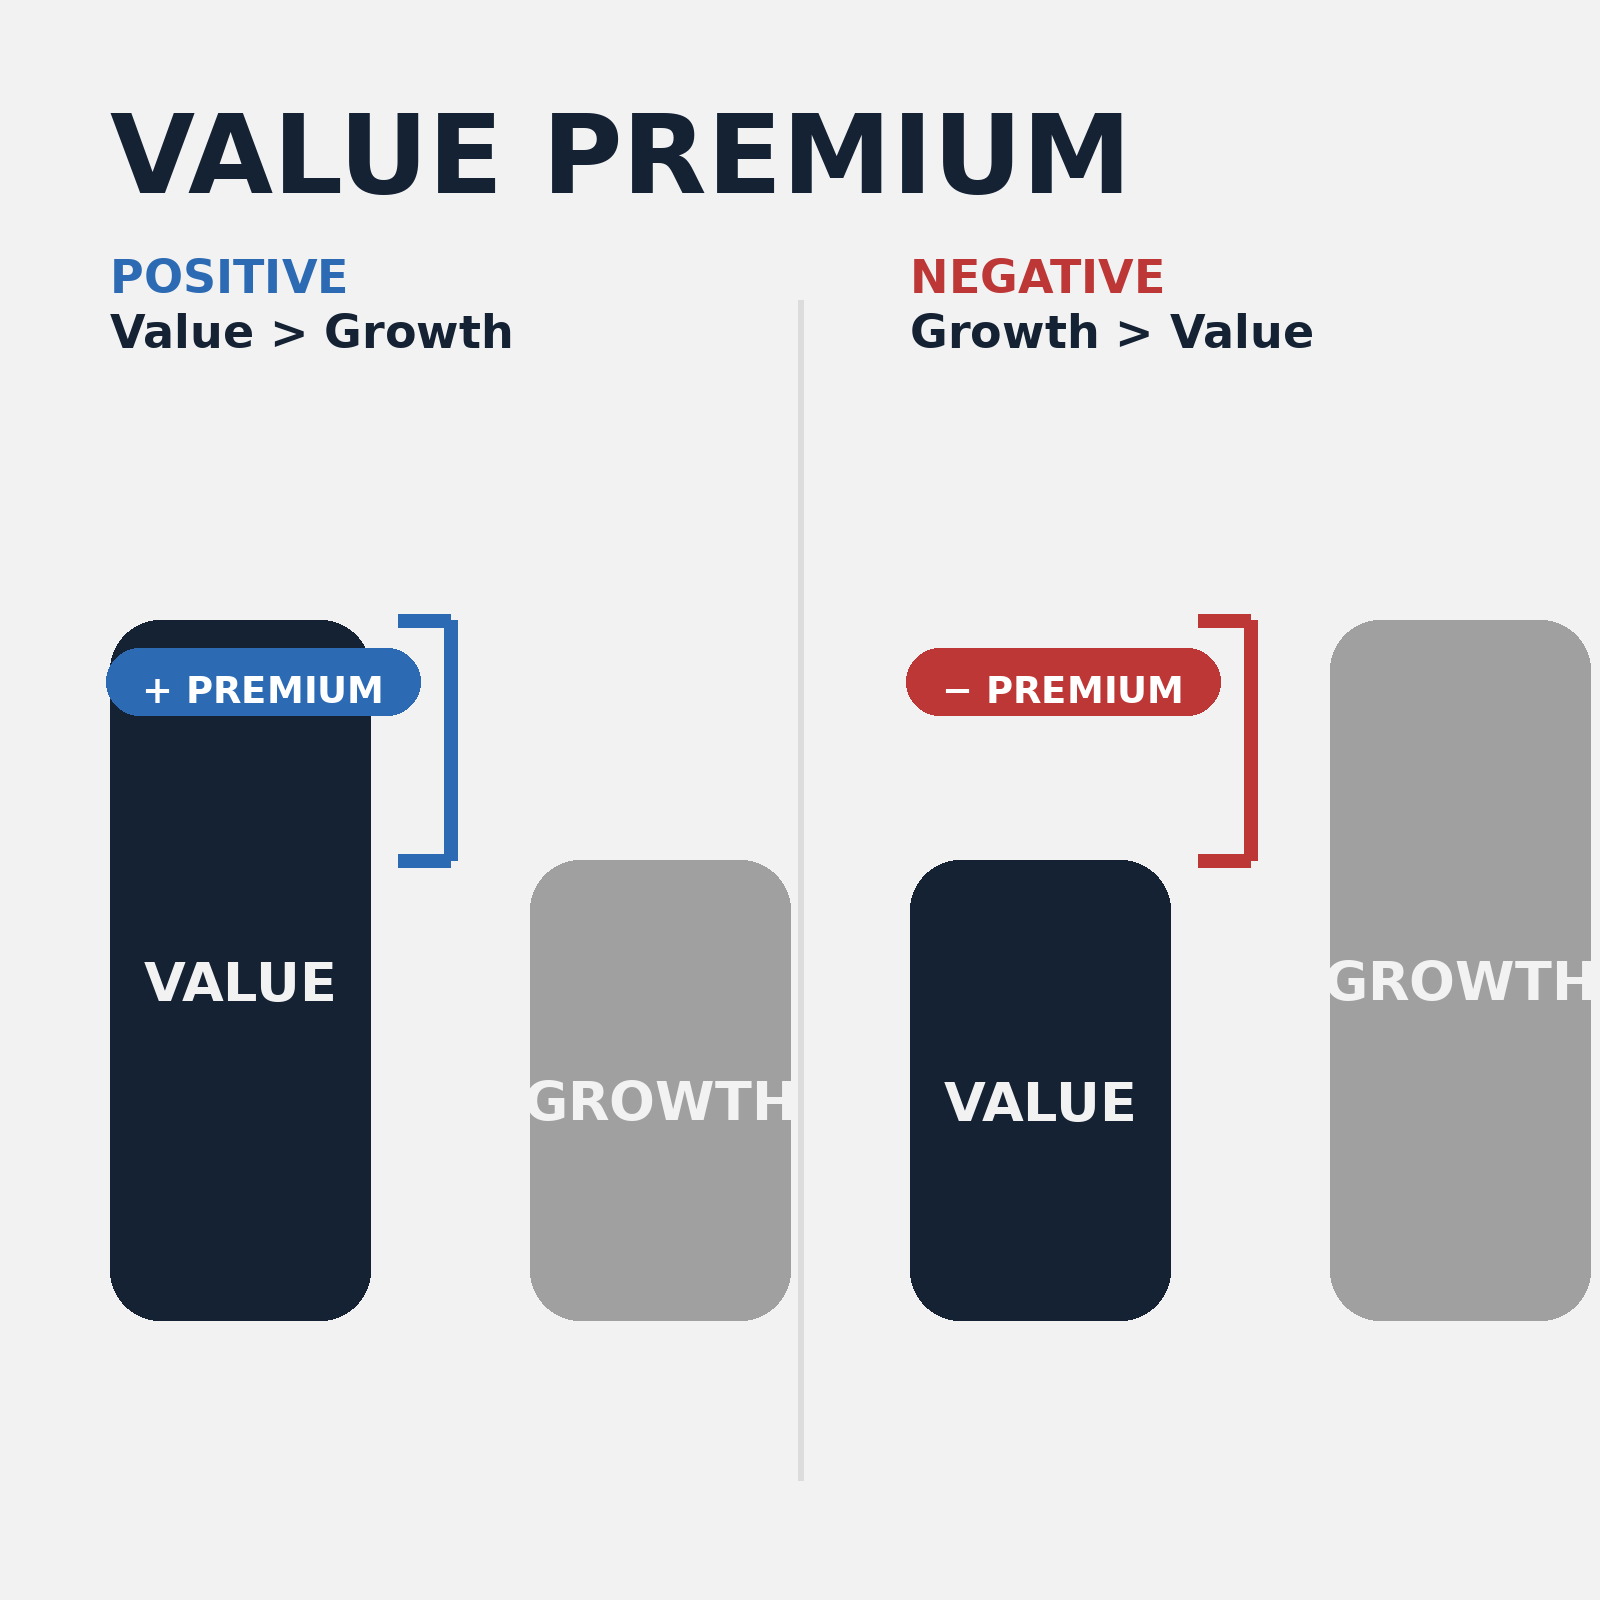
Value premiumₜ = RValue,ₜ − RGrowth,ₜ
HMLₜ = ½ × [(S/Hₜ − S/Lₜ) + (B/Hₜ − B/Lₜ)]
Where S/Hₜ is the return on small stocks with high book-to-market (cheap);
S/Lₜ is small stocks with low book-to-market (expensive), and likewise for large stocks.
The point of writing it this way is to make clear that value, in this tradition, is not a story first and a regression second. It is a portfolio construction rule that produces a long–short return series.
Over the very long run, the headline result is compelling. In the U.S., the value premium averaged roughly 3.5% per year from 1928–2017 (Asness et al. n.d.). The problem is that this average is a poor description of the lived experience of owning value. Value’s history is not a smooth upwards line. It is a sequence of regimes: long periods where value looks ‘dead’, punctuated by sharp recoveries that arrive after most investors have given up.
Value is Cyclical by Nature
All of the following sections pertain to the US until clearly specified.
If you want to understand why investors struggle with value, you only need a handful of decade-long snapshots.
In the 1930s, value underperformed sharply. Value’s annualised return was -4.5% versus +1.61% for growth (Fama and French n.d.). Volatility was also far higher for value, with annualised standard deviation around 57.28% versus 33.33% for growth (Fama and French n.d.). This matters because it is exactly the environment where ‘cheap’ stocks often are cheap for fundamental reasons, distress risk is real, and investors learn to associate value with pain.
In the 1940s, the relationship flipped. Value returned 16.31% annualised versus 6.9% for growth, with volatility that was much closer, roughly 19.82% versus 15.16% (Fama and French n.d.). This is an early example of a pattern that repeats throughout value’s history: after periods of extreme pessimism, the cheap end of the market can rebound hard because expectations embedded in prices become too low.
Fast forward to the post-dotcom era and you see the same logic play out. In the 2000s, value returned 3.57% annualised whilst growth returned -1.21% annualised, again with value more volatile at about 21.34% versus 16.31% (Fama and French n.d.). This decade is often treated as the ‘textbook’ value comeback, as the market unwound after an extreme growth valuation episode.
Then came the decade that made people ask whether value had permanently stopped working. In the 2010s, value returned 11.11% annualised whilst growth returned 15.11% annualised, with standard deviations around 16.23% versus 12.51% (Fama and French n.d.). The absolute return to value was still strong, but the relative gap persisted long enough to change many investors’ beliefs.
The late-2010s pain was not subtle. From 2017 through August 2020, the Fama–French Small Value index was about a -13% cumulative return, whilst Small Growth was about +71% (Swedroe 2021). That kind of divergence does not just test patience, it tests identity. It is how a factor premium ‘dies’ in the eyes of investors, even if it remains alive in the data.
Value Has Not Vanished
The early 2020s are useful because they show how quickly the narrative can flip when the macro-economic backdrop changes.
If you take the broad window from 1 January 2020 to 30 November 2025, growth still leads on an annualised basis: 18.04% for growth versus 15.83% for value. Value is also more volatile: 24.1% annualised standard deviation versus 18.63% (Fama and French n.d.).
But if you isolate the post interest rate reset period, from 1 January 2022 to 30 November 2025, value leads: 16.39% annualised for value versus 12.11% for growth, with volatilities much closer at 20.34% versus 18.09% (Fama and French n.d.).
That does not prove that you can time value using central bank forecasts. But It does illustrate a sensible structural intuition: when discount rates rise, assets whose valuations depend heavily on far-future cash flows often suffer multiple compression, and that tends to hit the most expensive growth stocks hardest. A point we delve deeper into in the following sections.
This is Not Just a US Story
Whilst the data are lacking in comparison to the US, we do still have reliable data from 1975 onwards; And indeed, one reason that the value premium is taken seriously is that it appears across countries, not only in one market at one time.
Using developed-market data across 23 countries (1975–2018), value outperformed growth in 18 of them, with a world-average premium of around 2.0% per year (Dimson, Marsh, and Staunton 2019). However, this is not universal as five countries had negative premiums over that sample, which is an important reminder that value is not a law of nature. Still, the breadth is difficult to dismiss as a fluke.
The UK evidence points in the same direction. The UK has historically exhibited a strong value premium over long periods and across both small-cap and large-cap segments. The UK is also a good reminder that sector mix matters. If a market has heavier weights in banks, energy, and cyclicals, its ‘value’ experience can look different from a market dominated by high-growth technology firms—like the US.
Why Does the Value Premium Exist at All?
There are two broad explanations, and the honest answer is probably ‘some of both’.
1) The Risk Story: Value is Genuinely More Painful to Hold
In the Fama–French interpretation, value firms often look distressed, cyclical, or financially constrained. They may be more exposed to the economic scenarios investors fear most. If value performs poorly in bad states of the world, investors will demand a higher expected return to hold it (Fama and French 1992; Fama and French 1993). Under this view, the long periods of underperformance make sense as the expected positive premium exists precisely because you are willing to own the part of the market at the time when most investors are unwilling to do so.
2) The Mispricing Story: Investors Overpay for Glamour, and Underpay for Dullness
The behavioural explanation argues that investors systematically extrapolate recent success too far. Growth gets bid up because it has a compelling narrative and recent winners feel ‘safe’. Value gets marked down because it looks boring, troubled, or obsolete. Over time, expectations mean revert. Growth does not need to fail for value to win, it only needs to disappoint relative to perfection implied by its valuation multiple (Lakonishok, Shleifer, and Vishny 1994).
A practical way to hold both ideas in your head is to remember what value investing really is. It is not ‘buying bad companies’. It is buying low expectations, and accepting that low expectations can be attached to real risk and real discomfort.
‘Is Value Dead?’ the Modern Challenge, Stated Properly
The strongest argument against value is not that the long-run record disappears, it is that some conventional implementations have weakened in the modern era, and the economy has changed in ways that can break simple valuation metrics.
One stark datapoint is the weakening of the premium among large stocks. For US large-cap value, the premium fell from roughly 4.3% per year (1963–1991) to about 0.6% per year (1991–2019) (Fama and French 2021). For US small-cap value, it fell from around 7% to about 4% over the same windows (Fama and French 2021). Those are meaningful declines, even if the premium remains meaningfully positive in the small segment.
There are at least three plausible reasons.
First, competition can compress premiums. Once a strategy is widely known and systematically harvested, some of the excess return can be arbitraged away.
Second, measurement may have worsened. Price-to-book, in particular, can be a blunt tool in an intangible-heavy economy, where a large share of economic capital is in R&D, software, data, and brand, and is not always captured cleanly in book value. If the denominator is mismeasured, you can misclassify some genuinely ‘cheap’ firms as ‘expensive’, and vice versa, diluting the signal. Indeed, Eduardo Repetto from Avantis has publicly stated how he believes goodwill and accruals can be used to ‘play games’.
Third, regime effects matter. The 2010s combined collapsing discount rates, repeated monetary support, and extraordinary concentration of returns in a handful of mega-cap growth firms. A decade like that can crush value for a long time without proving that the underlying mechanisms, risk compensation and expectation errors, have permanently vanished.
The investor takeaway is simple: ‘value’ as a concept is robust, but naïve value, defined by one metric with no safeguards, is fragile. This is why many implementations use multiple value signals, adjust for accounting distortions where possible, and often combine value with profitability or quality screens to reduce the worst value traps.
Value and Rising Rates or Inflation: Why the Intuition Often Holds, and Where It Breaks
It is tempting to say ‘value wins when interest rates rise’. Sometimes it does, but it is not a clean rule. The better way to think about it is through cash-flow timing and financing sensitivity.
Growth stocks tend to have a bigger share of their expected cash flows far in the future. In that sense, they behave like longer-duration assets: higher discount rates weigh more heavily on far-future cash flows, and valuations can compress sharply. Value stocks, with more of their cash flows nearer-term and lower embedded expectations, are often less exposed to that mathematical repricing channel.
There is also a financing channel. When the cost of capital rises, business models that rely heavily on cheap external funding, refinancing, or long-dated projects can become less attractive. That does not mean all growth is fragile, but it does mean that the more speculative end of growth tends to be more sensitive when capital is no longer close to free.
Finally, sector composition matters in practice. Many value indices tilt towards financials, energy, and other cyclical sectors. In inflationary macro-economic backdrops, those sectors can behave differently from technology-heavy growth indices. Therefore, part of what people call a ‘value inflation hedge’ is, in reality, a diversification story.
All in all, a healthy growth and inflation mix can be supportive for cyclicals and value. However, a stagflationary shock that crushes demand can be bad for equities broadly, including value.
A Forward-looking Lens: Valuation Spreads, Not Narratives
If you want a forward-looking argument for value that does not rely on macro-economic forecasting, focus on the valuation spread between cheap and expensive stocks. Even after value’s sharp rebound in 2022, the value spread remained extremely wide, around the 94th percentile by the end of 2022 (Research Affiliates n.d.). Historically, very wide spreads have tended to be followed by stronger subsequent value returns as relative valuations mean revert, although ‘the timing can be slow and the path can be ugly’ (Asness et al. various years).
This framing does not promise anything. It simply says that expected returns are linked to starting prices. When the spread is narrow, value is not offering much compensation. When the spread is extreme, value is offering more compensation, precisely because it is psychologically difficult to own.
Conclusion
The value premium is real in the only sense that matters: it has shown up repeatedly over long time horizons, and across many markets. It is also real in another sense that matters just as much: it is one of the hardest premiums to hold, because it can underperform for long stretches and make disciplined investors look foolish. The long-run US average, roughly 3.5% per year from 1928–2017, exists only because value ownership has repeatedly required endurance through episodes like the 1930s and modern stretches like the 2010s.
A sensible stance is cautious, not dogmatic. It is reasonable to believe that the positive value premium can persist, whether through risk compensation, behavioural mispricing, or both. It is also reasonable to expect the premium to be smaller, noisier, and more implementation-sensitive than it appeared in some earlier eras. The practical question is not ‘does value work in backtests?’, it is ‘can I actually hold it even when it looks broken?’. For most investors, that is the key question.
References
Asness, Clifford S., Andrea Frazzini, Ronen Israel, and Tobias J. Moskowitz. Various years. Research and commentary on value, value spreads, and long-horizon expected returns.
Basu, Sanjoy. 1977. ‘Investment Performance of Common Stocks in Relation to Their Price-Earnings Ratios: A Test of the Efficient Market Hypothesis.’ Journal of Finance.
Dimson, Elroy, Paul Marsh, and Mike Staunton. 2019. Credit Suisse Global Investment Returns Yearbook 2019: Summary Edition. Zurich: Credit Suisse Research Institute. Accessed 11 January 2026.
Fama, Eugene F., and Kenneth R. French. 1992. ‘The Cross-Section of Expected Stock Returns.’ Journal of Finance.
Fama, Eugene F., and Kenneth R. French. 1993. ‘Common Risk Factors in the Returns on Stocks and Bonds.’ Journal of Financial Economics.
Fama, Eugene F., and Kenneth R. French. 2021. ‘The Value Premium’. The Review of Asset Pricing Studies 11 (1): 105–121.
Fama, Eugene F., and Kenneth R. French. 2015. ‘A Five-Factor Asset Pricing Model.’ Journal of Financial Economics.
French, Kenneth R. n.d. ‘Kenneth R. French Data Library’. Tuck School of Business at Dartmouth. Accessed 2 February 2026
Lakonishok, Josef, Andrei Shleifer, and Robert W. Vishny. 1994. ‘Contrarian Investment, Extrapolation, and Risk.’ Journal of Finance.
Research Affiliates. n.d. ‘Asset Allocation Interactive’. Accessed 11 January 2026. https://interactive.researchaffiliates.com/asset-allocation
Swedroe, Larry. 2021. ‘Resurrecting the Value Premium’. Alpha Architect, May 4. Accessed 11 January 2026. https://alphaarchitect.com/resurrecting-the-value-premium