An Assessment of an Equal Weighting Strategy
Introduction
In a market-capitalisation weighted portfolio (also referred to as value-weighted), each company’s weight reflects its market value, so the portfolio closely tracks the risk and return of the overall market. Equal weighting strategies, by contrast, give the same weight to every stock in their respective universe. Most indices are weighted by market capitalisation with a couple of notable exceptions like the Dow Jones Industrial Average (DJIA) and the Nikkei 225. Why? The reason stems from the Capital Asset Pricing Model (CAPM) and the Efficient Market Hypothesis (EMH). Indeed, according to the CAPM, the expected risk and return of a stock is implicit in its price and EMH says that prices reflect all known information. Thus, a broad market-capitalisation weighted index theoretically represents the optimal mean-variance efficient investment (Malladi & Fabozzi, 2017).
Equal weighting, on the other hand, is often presented as a simple and intuitive way to improve on the returns offered by a standard value weighted index fund. The reason often given is that an equal-weighting strategy avoids ‘overvalued’ stocks or those that appear to be a ‘bubble’ about to burst. On the surface, there appears to be some truth to this claim, given several papers’ findings that an equal weighting strategy often outperforms a value weighting strategy on pure annualised return figures. However, once evaluated more closely, a different picture emerges. Any excess return over and above a value weighted index is largely compensation for taking on more risk. In particular, it is often compensation for taking on excessive size, value and illiquidity risk, rather than an indication of a more efficient portfolio.
The Mechanics of Equal Weighting
Mechanically, an equal weighted fund allocates significantly more capital to smaller companies and significantly less to larger ones by virtue of weighting each holding of the index equally. For example, Nvidia has a market capitalisation of $4.44 trillion as of November 2025 and makes up 8% of the iShares Core S&P 500 fund. However, in the iShares S&P 500 Equal Weight fund it only makes up 0.2%, meaning it is severely underweighted in the latter weighting strategy given its relative economic size. On the other end of the size spectrum, Expedia Group PLC has a market capitalisation of $32.43 billion as of November 2025 and makes up less than 0.1% of the iShares Core S&P 500 fund. However, it receives the same 0.2% weighting in the iShares S&P 500 Equal Weight fund because of the fund’s equal weighting rule.
Of course, in order to retain these equal weights, a significant amount of rebalancing is required over and above a value-weighted index. Indeed, Dai et al. (2022) find that the average turnover of an equal weighting strategy is 32% compared to 6% for the market, which is defined as all US firms excluding REITs. To explain, as individual stock prices move, the weights in an equal-weighted fund drift away from their targets, so the fund must regularly sell those stocks that have risen and buy those that have fallen to restore the equal weight allocation, incurring trading and transaction costs. By contrast, in a value-weighted index, the weights adjust automatically with market capitalisation, so stocks that perform well are simply allowed to become a larger part of the index, and much less trading is required to accommodate the same pattern of price changes. Moreover, the stocks that have recently performed strongly tend to become large-capitalisation names, and under a value-weighted scheme their growing market value naturally increases their index weights without any explicit rebalancing. In an equal-weighted portfolio, however, these same winners must be cut back at each reconstitution point to prevent them from dominating the portfolio, which along with the consequence of higher trading and transaction costs, also has the unintended impact of limiting participation in any upwards price movement.
Equal weighting can also work against investors on the downside. For example, if a stock starts to struggle due to a reduction in its competitive advantage for whatever reason, the market will quickly adjust its expectations of future expected cash flows downwards and likely assign a higher discount rate to reflect the increased risk. This will lead to a lower stock price and, in turn, lower exposure to that stock in the market portfolio. In an equal weighting strategy, this cannot happen because all stocks must be weighted equally. Thus, taken together, investors in an equal weighted fund are both limited in their participation of the upside and proportionately overexposed to any downside simply due to the mechanics of equal weighting.
An Inadvertent Small Tilt?
The consensus within the literature is that equal-weighted indices often outperform standard value-weighted indices on an unadjusted risk-return basis. The findings from Dai et al. (2022) also confirm this in an all-cap US backtest from 1974 to 2019. However, this should be interpreted with significant caution. Indeed, Exhibit 2 from Dai et al. (2022) shows that around two-thirds of the equal weighting strategy’s assets sit in micro-caps alone, even though these names represent only about 4% of the market’s capitalisation. Thus, we can already see one of the dangers at play with such an approach; namely concentration risk.
A sceptic may point to the positive alpha of the backtest compared with the market as a form of rebuttal. To counter this, we need to go back to investment theory briefly. Rationally, if a group of stocks has a higher amount of systematic risk associated with it, investors will demand a risk premium to hold that group in order for markets to clear; I.e., for there to be a buyer for every seller. We thus arrive at the size premium in the Fama-French Five Factor model. For investors to hold small stocks, they will demand a risk premium. Therefore, given a long enough period of time to filter out any noise, we would rationally expect an equal weighting strategy to outperform the market. To reiterate, this is because an equal weighting strategy is significantly riskier than a value weighted alternative. For this reason, Dai et al. (2022) also perform a backtest that excludes micro-caps from the eligible investable universe. By doing so, the authors can remove the size bias and produce a closer apples-to-apples comparison of an equal weighting strategy vs the market. Unsurprisingly, this subsequently leads to the equal weighting strategy producing an alpha above the market that is statistically insignificant. Thus, we can say with a high degree of certainty that it is an excessive small size tilt that is inadvertently driving returns within an equal weighting strategy. Of course, because risk and return go hand-in-hand, this excessive size tilt also increases volatility and insolvency risk compared with a value weighted alternative. Consequently, the authors stress that ignoring market prices leads to unbalanced emphasis on the size premium and also leads to extreme over and underweights at both the sector and individual stock level, which can expose investors to unnecessary idiosyncratic risk. This could be removed by simply holding a more diverse and balanced portfolio, i.e., the market portfolio. Thus, an equal weighting strategy can lead to outcomes that may be very different from the broad equity market, otherwise known as tracking error risk.
All this is also before considering the practicalities of such an approach. Crucially, micro-cap stocks are exactly where trading costs, bid–ask spreads and price impact are largest, and an equal weighting strategy forces the fund to trade far more frequently than a value weighting strategy in order to keep everything at the same weight. In other words, and in the real world, the extra return that these micro-cap stocks theoretically deliver in a backtest would likely be eaten up – and very likely more than eaten up in the majority of scenarios – by the high costs of buying, selling and constantly rebalancing them (Dai et al., 2022).
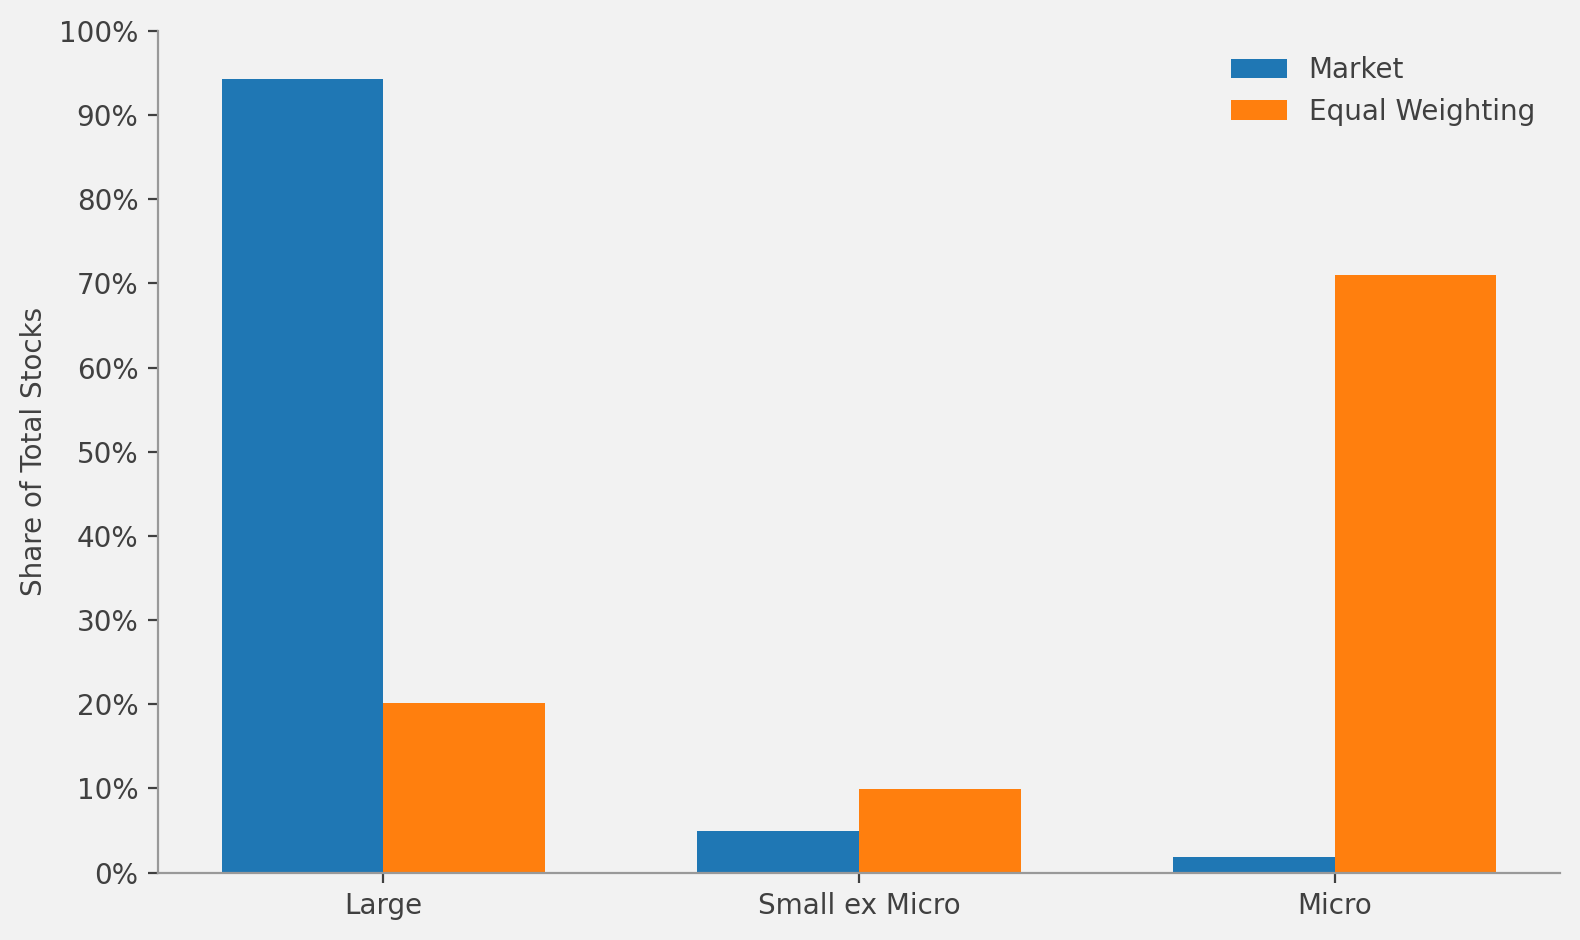
Figure 1. Size exposure within market-cap vs equal weighting strategies adapted from Dai et al., 2022. Approximately two thirds of equal weighting’s strategy is invested in micro-cap stocks.
An Inadvertent Value Tilt?
In a similar vein, Dai et al. (2022) show that an equal weighting strategy has a strong value tilt, with roughly three-quarters of the portfolio in value stocks compared with about half for the market. Furthermore, the equal weighting strategy also has a pronounced bias towards low-profitability firms relative to the broad market. Of course, a deliberate and modest value tilt may be expected to enhance returns given a long enough time horizon, given the higher expected returns of a value strategy over and above the market. However, and as we have seen in the 2010s, value can also underperform growth significantly and over long periods of time. Therefore, an equal weighting strategy that has significantly less profitability exposure and significantly more value exposure than the market is a de facto strong value bet at best and negligent asset management at worst.
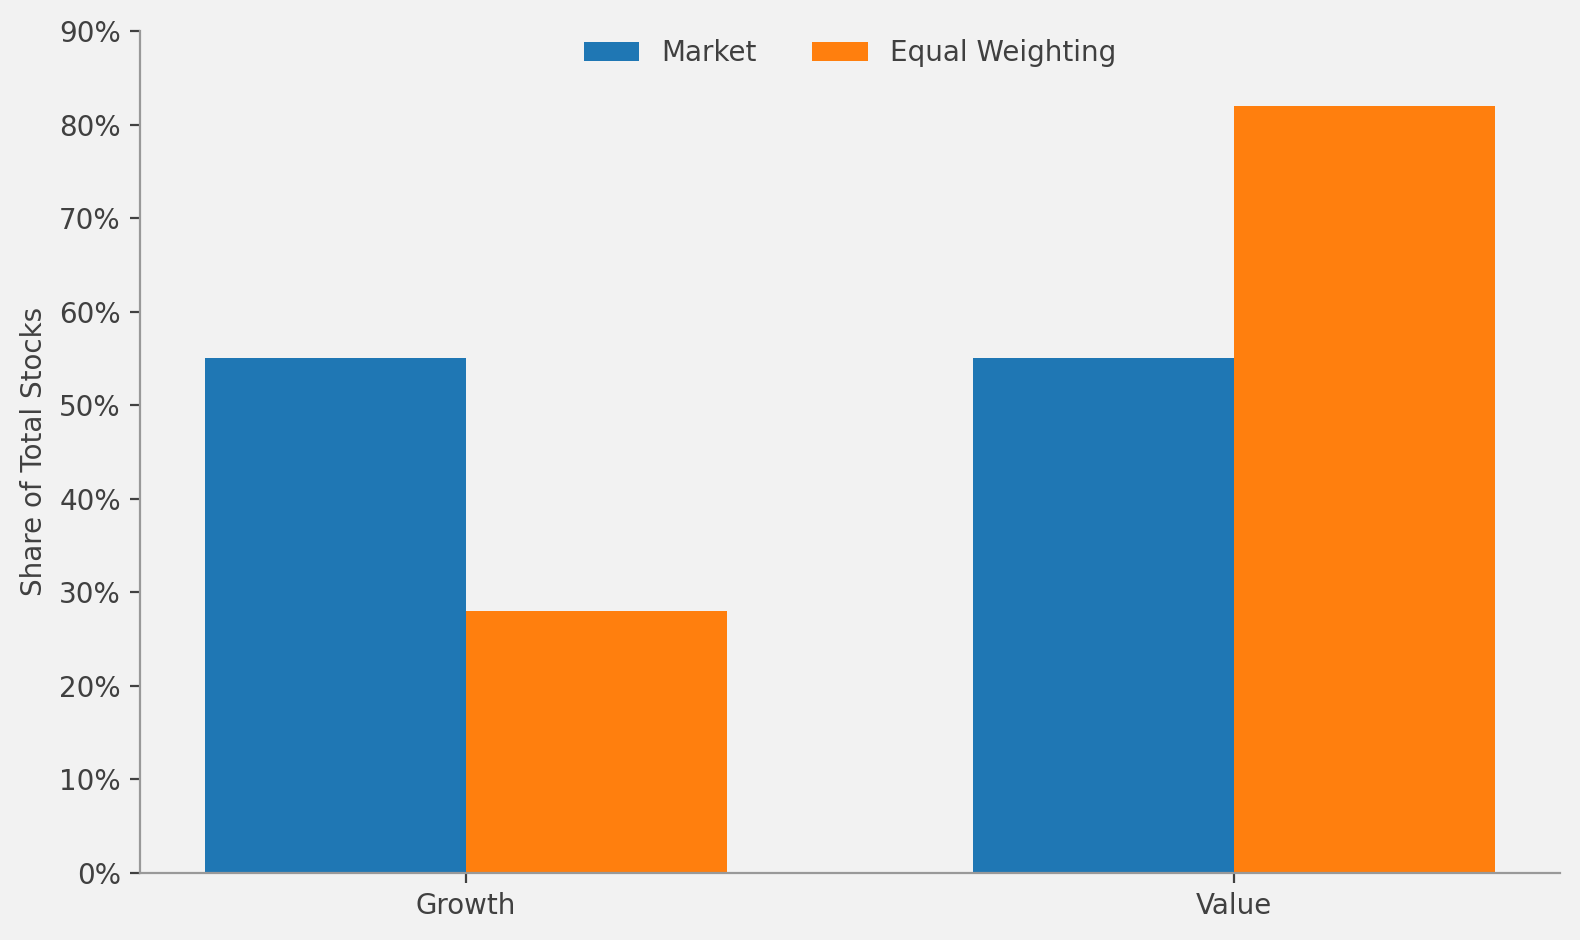
Figure 2. Value exposure within market-cap vs equal weighting strategies adapted from Dai et al., 2022. Approximately four fifths of equal weighting’s strategy is invested in value stocks.
Removing the Benefit of Momentum
Equal weighting also neglects momentum, which firms like Dimensional explicitly seek to harvest in their ‘Core’ range of funds for example. To explain, a momentum-aware approach often delays trading in strong recent winners and avoids aggressively adding to recent losers to slightly enhance returns. By contrast, an equal-weighting strategy systematically sells recent winners and buys recent losers at each rebalance in order to push every holding back to the same target weight, so it is constantly leaning against price trends rather than riding with them. The result is that equal weighting effectively implements a systematic ‘anti-momentum’ or contrarian tilt, giving up a well-documented and empirically robust extra source of return that more sophisticated strategies deliberately try to capture.
Evidence from an Equal Weighting Strategy Paper
The paper from Malladi & Fabozzi (2017), which is often cited in favour of equal weighting, actually documents that the higher historical returns come with consistently higher volatility than a market-cap weighting strategy in aggregate. Furthermore, the authors show that the excess Sharpe ratio, which is a measure of risk-adjusted return, has been negative from 2009 to 2014 for the equal weighting strategy. The authors define ‘excess risk’ as the standard deviation of the equal weighted portfolio minus that of the corresponding market-cap weighted portfolio. Using both simulations and data from 1926 to 2014, they find that equal weighted portfolios almost always have a higher standard deviation than market-cap weighted alternatives, and that excess risk is positive in the vast majority of scenarios. Clearly, excess risk without a commensurate higher expected return is not desirable. Importantly, though, excess risk may not be desirable even with a higher expected return for more defensively minded investors.
In fairness, the authors also show that the observed excess Sharpe ratio is positive in most periods. This means that the equal weighting strategy produces a higher risk-adjusted return in the paper and so the strategy could be viewed as a more efficient portfolio compared to the market-cap weighted strategy. Crucially though, and in the authors’ own words, this is time varying and there have been periods where the excess Sharpe ratio for the equal weighted portfolios has been negative. This is no surprise. Given that an equal weighting strategy has excess exposure to the size and value premia as discussed above, we would expect the excess Sharpe ratio to be time varying as these premia become either positive or negative through time. It is a shame that the study is not a little more recent, as it is likely that it would have shown the negative excess Sharpe ratio trend continuing onwards from 2014 until 2022, when value’s fortunes turned around. An updated study would be welcomed to draw further insight from.
Implementation, Costs and Capacity
As already touched on briefly, equal weighting raises serious questions about implementation, trading costs and capacity. Indeed, because the strategy involves frequent rebalancing and heavily overweighting small and micro-cap stocks, it naturally results in higher turnover and higher participation in the trading volume of illiquid names. Dai et al. (2022) show that equal weighting funds often need to trade a large proportion of a stock’s average daily volume in order to maintain their target weights. At realistic participation limits, this increases estimated trading costs and materially slows down the speed at which a large portfolio could be liquidated. In stress tests of a hypothetical institutional sized portfolio, a significant fraction of the strategies analysed in the paper could not be fully liquidated within several trading days without breaching conservative trading limits. These features are all part of the ‘risk package’ that an investor is effectively buying into when they choose equal weighting over a straightforward value weighted fund.
Conclusion
Overall, equal weighting does not provide a more efficient or more diversified alternative to a value-weighted fund. It is a quite aggressive departure from the market portfolio that increases exposure to size, value, concentration and illiquidity risk, and introduces substantial idiosyncratic and implementation risk that creates high tracking error relative to the broad market. Any historical outperformance is best interpreted as compensation for taking on this bundle of additional risks rather than as evidence of a structural flaw in value weighting. For investors who wish to pursue higher expected returns than the market, it is generally more transparent and controllable to allocate to explicitly designed small cap or multi factor strategies that use prices as information, manage turnover and capacity, and target desired risk exposures directly, rather than relying on the blunt instrument of equal weighting.
References
Dai, W., Saito, N., & Wang, G. (2022). Weighting for the Right One: Weighting Scheme Design for Systematic Equity Portfolios.
Malladi, R., & Fabozzi, F. J. (2017). Equal-weighted Strategy: Why it outperforms value-weighted strategies? Theory and evidence. http://faculty-research.edhec.com/_medias/fichier/edhec-position-paper-smart-beta-2-0_1378195044229-pdf.