Market Concentration and Valuations: Historical Perspective and Implications for Expected Returns
Recent discussion (early 2026) of the US equity market has been dominated by two related observations from many onlookers: a small cohort of mega-cap stocks has accounted for an ‘unusually’ large share of index returns, and those same stocks now represent a relatively large share of the index’s market capitalisation*. Breaking this down into some meaningful analysis, Ben Felix’s discussion of the ‘AI bubble’ is useful because it gets to the heart of two distinct issues. Concentration is a statement about index composition and the distribution of weights. Valuation is a statement about the price investors are paying for future cash flows, and therefore the more direct channel through which today’s market conditions can shape long-horizon expected returns (Felix 2026).
A disciplined way to approach the ‘Magnificent Seven’ question is therefore empirical and conditional. First, have markets previously reached similar levels of concentration, either within the US or internationally? Second, when concentration has been high, what has tended to happen to subsequent returns? Third, what does the valuation literature imply about expected returns when starting valuations are elevated? Only once these are separated can we avoid the common error of treating concentration itself as a forecast.
*The top 7 holdings in the S&P 500 made up 32.97% of the index on 31st December 2025 (Morningstar n.d.).
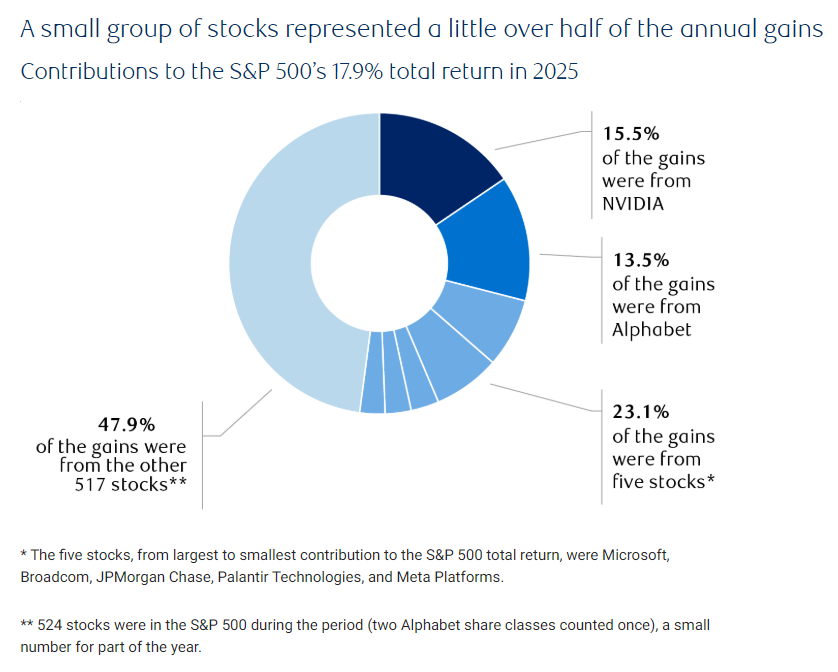
Figure 1. This chart taken from Bogdanova (2026) highlights how much of the S&P 500’s returns were derived from a handful of larger firms.
Concentration Has Clear Historical Precedents, Often Outside the US
Extreme concentration is not an exotic feature exclusive to modern US markets. In smaller national markets, it has sometimes been far more pronounced. Indeed, the case of Finland around the turn of the millennium is far more extreme. Nokia became so large relative to the Helsinki market that its weight increased from 9% all the way up to 72% in the period studied by Lally (2008). In other words, one stock made up 72% of a domestic market. Clearly, therefore, plausible real-world conditions can produce an index whose behaviour is heavily dictated by one single firm’s fundamentals and its valuation (Lally 2008).
Looking more globally, MSCI shows that concentrated leadership is recurrent rather than unique: prior episodes include Japanese financials around 1989 and the technology sector around 1999 (MSCI 2023a).
Readers may rightly argue that all of these instances led to subsequent market crashes and therefore jump to the conclusion that high market concentration equals terrible near-term investment outcomes. However, correlation does not equal causation.
Returns After High Concentration: A Weak Relationship At the Market Level, but Mean Reversion Among ‘Leaders’
Felix’s analysis within the US is directly responsive to the claim that ‘high concentration must imply poor future returns’. Using US data back to 1926 and sorting subsequent 10-year returns by the starting concentration of the top seven stocks, he finds only a slight negative relationship, and not a statistically significant one. In plain terms, concentration on its own has been a noisy and economically weak signal for future market returns (Felix 2026).
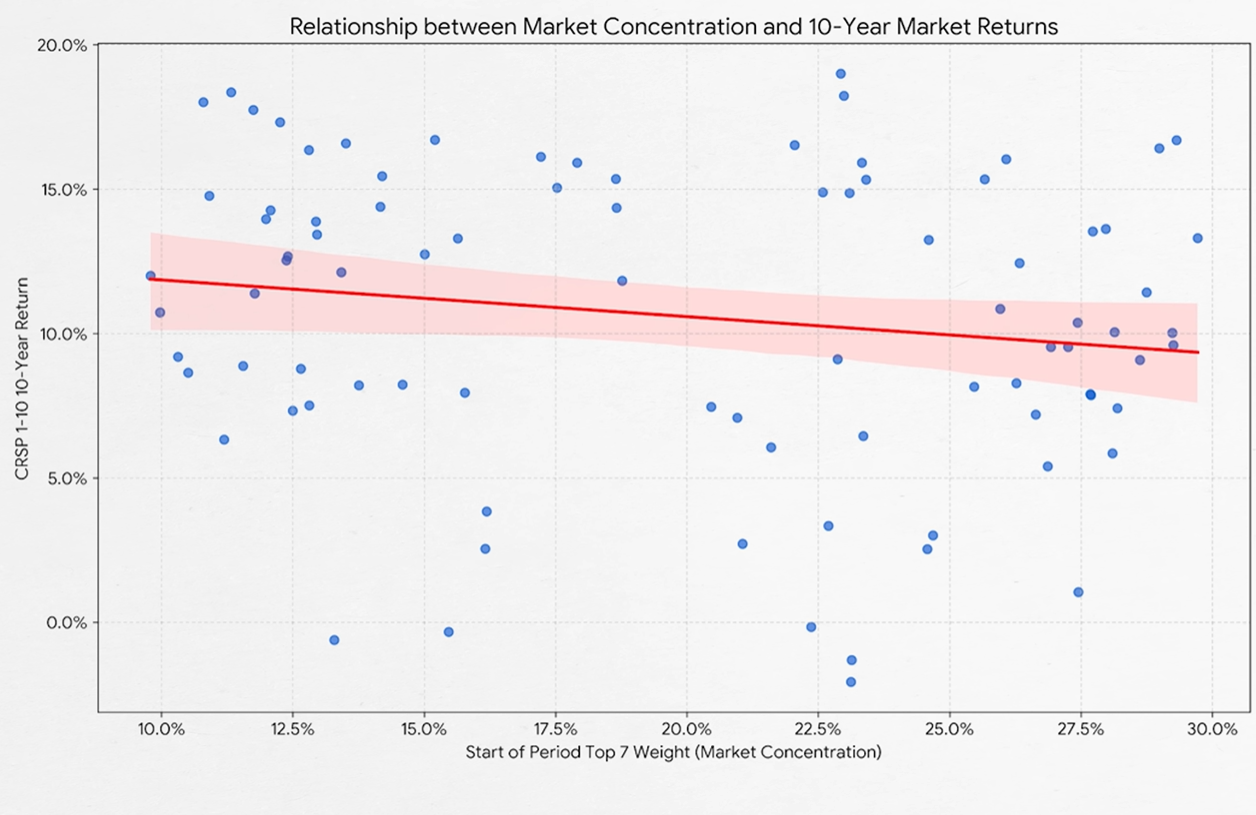
Figure 2. This chart taken from Felix (2026) shows that there is a slight relationship between market concentration and subsequent 10-year returns, but that this is statistically insignificant.
That finding sits comfortably with the broader intuition that equity markets are structurally dependent on a thin right tail of extreme winners. Bessembinder (2018) shows that the best-performing 4% of US listed stocks explain the net wealth creation of the market since 1926, whilst the majority of stocks underperform Treasury bills over their lifetimes. If wealth creation is inherently concentrated in a small minority of names, it would be surprising if periods of heightened index concentration reliably predicted poor market returns (Bessembinder 2018).
However, a weak relationship between concentration and market returns does not imply that the dominant stocks themselves are likely to keep outperforming. On that narrower question, the evidence is less forgiving. MSCI finds that top weighting index status has rarely translated into sustained outperformance. Of the 75 companies that entered the top 10 by weight in the MSCI World since 1974, only 19 went on to outperform the index when measured from the month after their entry into the top 10 and using their subsequent trading history (MSCI 2023b).
Dimensional reports a similar pattern for the US: the ten largest stocks have, on average, done reasonably over short horizons after becoming dominant, but have tended to underperform the market on average over subsequent five- and ten-year horizons (Dimensional 2024).
This is the first important nuance. Concentration is not, by itself, a reliable predictor that the market will deliver poor future returns. But high concentration does appear to be associated with a higher chance that the dominant cohort’s subsequent relative returns are less exceptional than investors might extrapolate from the prior decade. Part of the reason is that market leadership is rarely permanent. MSCI (2023b) shows that over time the dominant cohort is usually replaced by new firms or sectors as valuations reset, growth slows, competition intensifies and the market’s leadership rotates.
Cross-Country Evidence: Many Markets Are More Concentrated Than the US And Still Deliver an Equity Premium
Felix also addresses the tendency to treat US concentration as uniquely alarming by stepping outside the US. Looking at the top ten non-US developed markets and measuring the top-seven weight a decade earlier, he reports that the average top-seven weight in November 2015 was about 41%, with Switzerland notably higher and Japan notably lower; over the subsequent decade to late November 2025, those markets delivered a meaningfully positive USD return on average, and at least one highly concentrated market (Taiwan) outperformed the US over that window (Felix 2026). The broad pattern is that the cross-country relationship between concentration and subsequent returns looks ‘noisy at best’ (Felix 2026).
This matters because it removes a common rhetorical crutch. If many markets have historically been more concentrated than the US and still produced a positive equity risk premium, then concentration cannot be treated as a mechanically bearish condition. The forward-return concern must come from somewhere else.
Valuations Are the More Direct Expected-Return Concern
The valuation channel can be stated as:
Expected long-run equity return ≈ shareholder yield + real earnings growth + change in valuation multiple
The last term is the critical one. If a decade of returns has been aided by valuation multiple expansion, then some returns have effectively been pulled forward from the future. Thus, repeating this experience requires either further multiple expansion, unexpectedly strong fundamentals, or both. This is why valuation ratios have played such a large role in the academic literature on long-horizon expected returns.
Campbell and Shiller (2001) show that valuation ratios such as dividend–price and price–earnings ratios are useful primarily for forecasting future price changes over long horizons rather than future dividend growth, consistent with the idea that extremes in valuation tend to be corrected through subsequent price movements (Campbell and Shiller 2001).
In applied work, Asness (2012) documents a near-monotonic relationship between starting CAPE regimes and subsequent 10-year real returns in US data: higher starting CAPE has historically been associated with lower subsequent average real returns (Asness 2012).
Felix’s own cross-country exercise is consistent with this valuation-first framing. Using rolling 10-year windows for the ten largest developed markets back to 1982, he reports a clearer monotonic relationship between starting CAPE and subsequent 10-year returns than between concentration and returns, whilst acknowledging the statistical issues created by overlapping samples and cross-country comparability (Felix 2026).
This is the centre of gravity for the ‘Mag 7’ question. If the US market and its dominant cohort are both characterised by elevated valuations, then it is reasonable to moderate expectations for long-horizon returns. That does not imply an imminent crash. It implies a less favourable starting point for compounding, and a greater sensitivity to any repricing of long-duration growth cash flows.
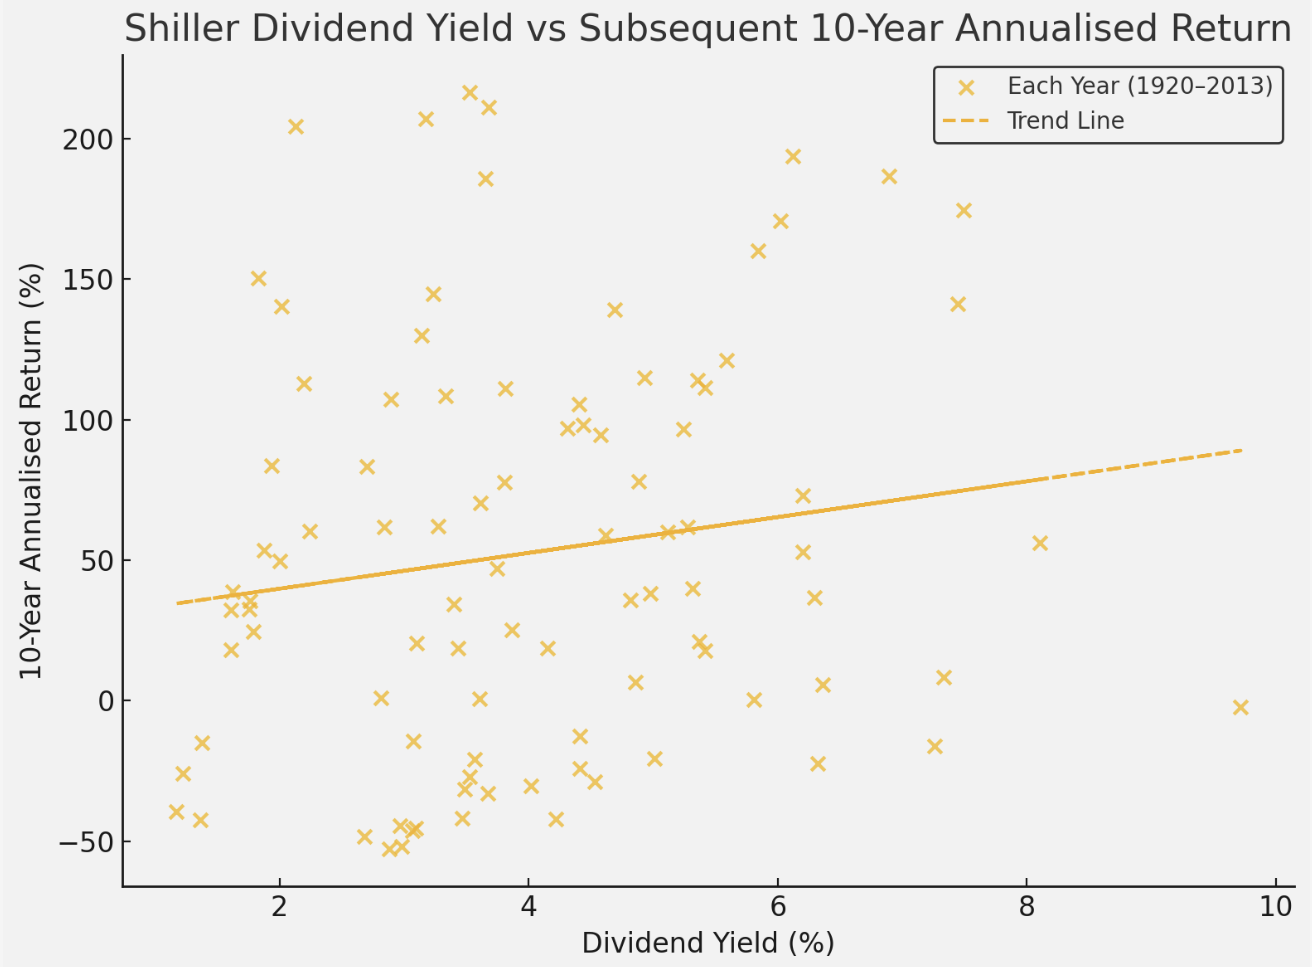
Figure 3. Dividend Yield vs Subsequent 10-Year Stock Returns.
This chart shows the historical relationship between dividend yields and subsequent 10-year annualised real returns for US stocks, based on data from Nobel Laureate Robert Shiller.
Each cross represents a single year between 1920 and 2013. For each year, we plot:
X-axis: The dividend yield at the start of the year (calculated as dividends divided by the S&P Composite Index price).
Y-axis: The annualised return over the next 10 years, adjusted for inflation.
The dashed line is a trend line showing the overall relationship between these two variables.
What the Chart Tells Us
The chart hints at a modest relationship between dividend yields and subsequent 10-year returns. The trend line slopes upwards, indicating that, on average, years with higher dividend yields have been followed by somewhat better long-term returns.
When dividend yields were high (for example, above 4%), the crosses tend to appear higher on the chart, indicating stronger real returns over the following decade.
When dividend yields were low (below 2%), future returns were often weaker, though with considerable variation.
Whilst the pattern is far from precise, it supports the general idea that valuation matters: when investors pay less for a dollar of dividends (higher dividend yield), their future returns have historically tended to be higher, on average.
Concentration Still Matters, but Primarily for Risk Shape Rather Than Return Level
Treating valuations as the primary expected-return input does not mean concentration is irrelevant. Concentration changes the portfolio’s exposure to idiosyncratic firm-level outcomes. Gabaix’s ‘granular’ hypothesis formalises why the usual diversification intuition can weaken when the firm-size distribution is fat-tailed: idiosyncratic shocks to the largest firms need not wash out at the aggregate level, and can explain a meaningful fraction of aggregate fluctuations (Gabaix 2011).
This fits naturally with Felix’s behavioural point about diversification. Diversification ensures continuous ownership of both recent winners and recent laggards, which is psychologically difficult precisely when markets are concentrated and narratives are strong (Felix 2026). The practical implication is that concentration can raise the temptation to abandon market-cap weighting at the wrong time, even if concentration itself is not a strong return-forecasting variable.
What Follows for the ‘Magnificent Seven’ Discussion
A careful conclusion is necessarily conditional.
Historical precedent for dominance is clear, and in some markets far more extreme than the current US episode (Lally 2008; MSCI 2023a).
The relationship between market concentration and subsequent market returns appears weak and noisy in both US time-series evidence and cross-country comparisons (Felix 2026).
The more robust long-horizon concern is valuation: higher starting valuations have historically been associated with lower subsequent long-horizon returns, even though the relationship is noisy and not a timing tool (Campbell and Shiller 2001; Asness 2012).
Whilst concentration is a poor standalone return forecast, leadership persistence is historically limited: dominant cohorts often fail to continue outperforming after reaching top-tier weights (MSCI 2023b; Dimensional 2024).
In that sense, the ‘problem’ posed by the Magnificent Seven is not that markets have never been concentrated before. The more defensible concern is that a large share of index weight is now tied to a small cohort whose prices embed demanding assumptions. If those assumptions are merely met rather than exceeded, future returns can be perfectly positive yet still fall short of what investors have come to regard as ‘normal’ after an unusually favourable recent decade or so.
References
Asness, Clifford S. 2012. ‘An Old Friend: The Stock Market’s Shiller P/E’. AQR Capital Management.
Bessembinder, Hendrik. 2018. ‘Do Stocks Outperform Treasury Bills?’ Journal of Financial Economics 129 (3): 440–57.
Bogdanova, Kelly. 2026. ‘U.S. Equity Returns in 2025: Record-breaking Resilience.’ RBC Wealth Management, January 8, 2026.
Campbell, John Y., and Robert J. Shiller. 2001. ‘Valuation Ratios and the Long-Run Stock Market Outlook: An Update’. NBER Working Paper No. 8221.
Dimensional Fund Advisors. 2024. ‘Large and In Charge? Giant Firms Atop Market Is Nothing New’.
Felix, Ben. 2026. ‘The “AI Bubble”’ (video). Rational Reminder / YouTube.
Gabaix, Xavier. 2011. ‘The Granular Origins of Aggregate Fluctuations’. Econometrica 79 (3): 733–72.
Lally, Martin. 2008. ‘Betas, Market Weights and the Cost of Capital: The Example of Nokia and Small Cap Stocks on the Helsinki Stock Exchange’. International Review of Financial Analysis 17 (5): 805–19.
Morningstar. n.d. Accessed March 20, 2026.
MSCI. 2023a. ‘Insights from Past Concentrated Rallies and Thematic Opportunities’.
MSCI. 2023b. ‘AI’s Moment and Insights from Themes Past’.
Shiller, Robert J. 2024. U.S. Stock Markets 1871–Present and CAPE Ratio. Yale School of Management. Available at: http://www.econ.yale.edu/~shiller/data.htm (accessed July 8, 2025).