Nominal vs Real Yield Curves: Understanding Inflation Protection
Before diving into this piece, it is worth defining what we mean by nominal and real yields. The nominal yield is the return in today’s pounds/dollars, including inflation, whereas the real yield is the return after inflation expectations, i.e., in ‘purchasing power’ terms. Thus, the nominal yield moves a lot with inflation expectations (and inflation risk premia), but the real yield moves more with real growth expectations and the real rate investors demand.
The relationship between nominal and real bond yields is one of the most commonly misunderstood areas of fixed income. Advisers and investors often see two government yield curves, the nominal gilt curve and the index-linked gilt curve, and assume they offer similar signals about interest rates or inflation. Sometimes they are even used interchangeably when discussing what yields are doing. Yet these two curves reflect different parts of the market’s expectations and behave differently through time. That misunderstanding can lead to misplaced confidence about how inflation-linked bonds will perform in a given environment and why the experience of holding them can diverge sharply from the inflation reality visible in the headlines.
The nominal yield curve shows the return that investors demand to lend money in fixed pound terms. It reflects how much investors need to be paid to give up money today and receive cashflows tomorrow after they have been eroded by future inflation. The real yield curve, by contrast, applies to index-linked gilts whose cashflows rise with the cost of living. It reflects how much compensation investors require after inflation has already been accounted for. Linking the two is the breakeven inflation rate, the approximate inflation expectation implied by nominal minus real yields. In the neat world of academic finance, this identity would cleanly separate expected inflation from the real return required by investors, making it appear that breakevens tell us exactly what the market expects inflation to be.
Reality, however, is more complicated. The spread between nominal and real yields reflects more than just inflation expectations. The index-linked gilt market is smaller, less liquid and dominated by institutional investors, such as pension funds and insurers, with long-dated, inflation-linked liabilities. Because liquidity is limited, real yields incorporate a liquidity premium that pushes them up, making linkers look cheaper than theory would suggest. At the same time, those liability-driven investors are often willing to pay a premium for inflation protection, which pushes real yields down. Regulatory rules and the continued use of RPI distort pricing further. Instead of a pure inflation expectation, the breakeven inflation rate becomes inflation expectations plus the value the market places on inflation insurance at that moment.
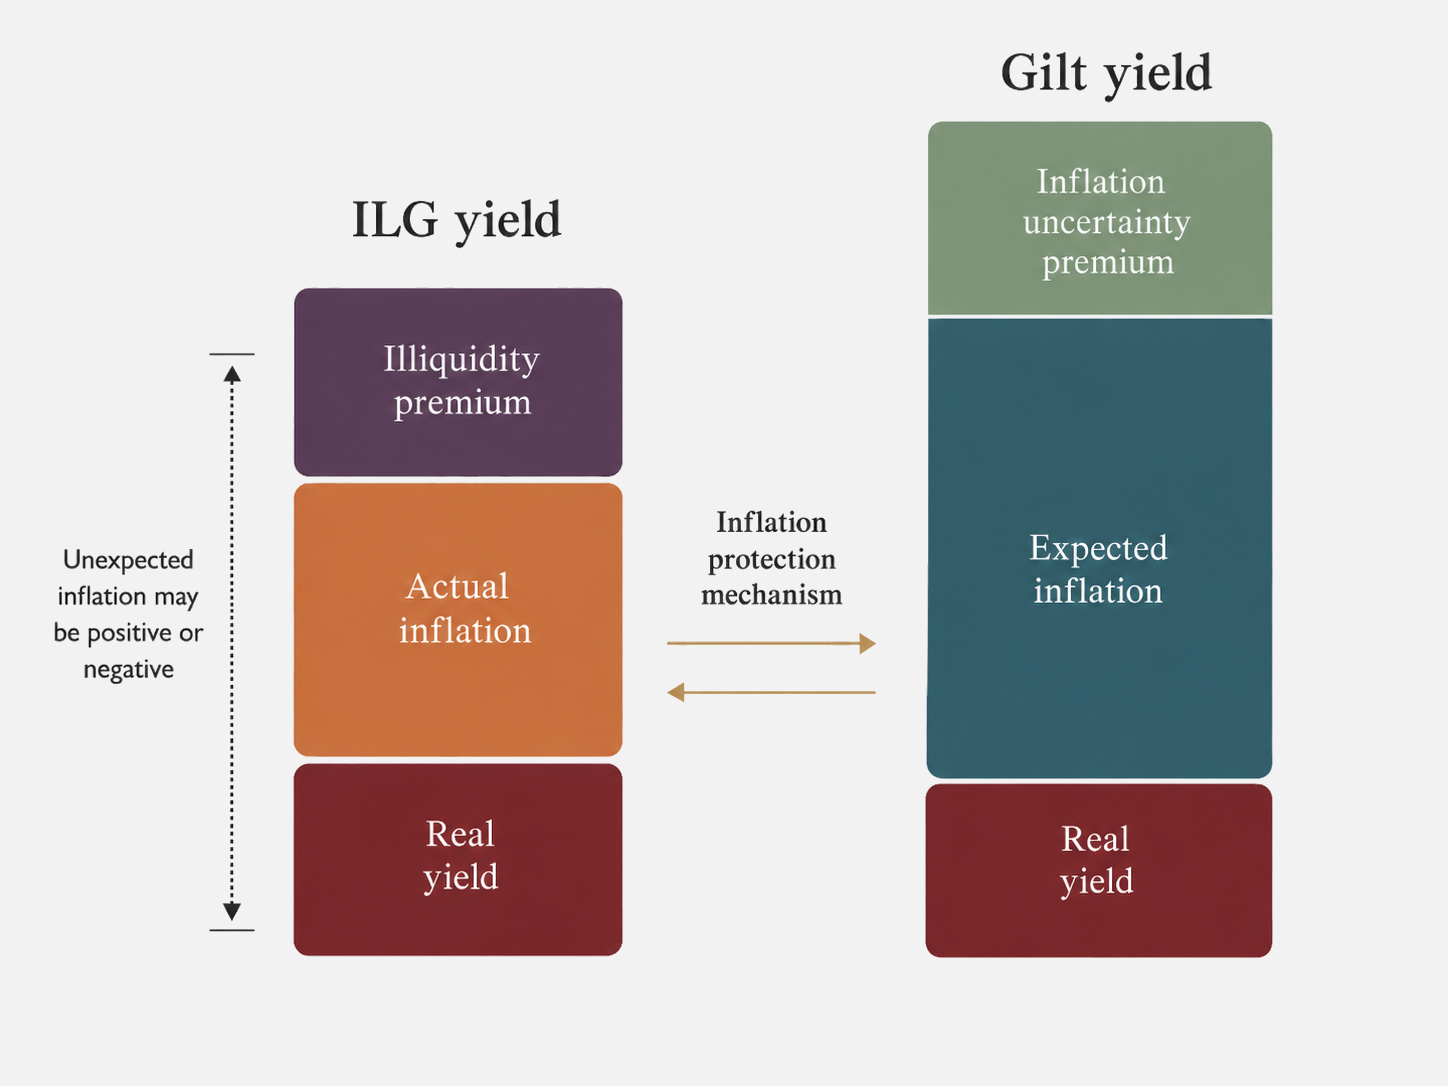
Figure 1. Components of nominal gilt and index-linked gilt yields. The nominal gilt yield is shown as higher because it includes expected inflation and an inflation uncertainty premium, whilst the index-linked gilt yield reflects the real yield, realised inflation and an illiquidity premium.
This distinction matters enormously for performance. Index-linked gilts provide inflation-linked cashflows, but the present value of those cashflows is set using the real yield curve. When real yields rise, the discount rate rises too, and the price of the bond falls. That mechanical valuation effect is powerful and often overwhelms the gradual uplift from matching RPI inflation in the coupon and redemption payments. Investors assume that inflation-linked means ‘goes up when inflation is high’, but what drives linker returns is not inflation in isolation. It is the change in real yields and whether breakevens move enough to offset that change.
To see this dynamic clearly, consider three distinct macroeconomic situations that frequently arise.
Gilt vs Index-Linked Gilt Prices Under Different Inflation Scenarios
First is a classic disinflation or tightening cycle where central banks regain credibility.
Assume both bonds have about 7 years of duration (real or nominal).
A) Real-yield shock with breakevens (inflation expectations) down (common in tightening/disinflation scares)
Move: ‘real +1.0%’, ‘breakeven −0.8%’ ⇒ ‘nominal +0.2%’
Inflation linked bond: ≈ −7.0% price (1.0% × 7)
Nominal bond: ≈ −1.4% price (0.2% × 7) ⇒ ≈ −1.4%
→ Nominal bond falls less.
Here, real yields often rise because investors demand a higher real return in a higher-rate world. If a central bank raises the bank rate, it follows that investors will demand higher real yield in line with the higher bank rate. However, breakevens usually fall, because inflation risk premia and expected inflation decline. The result is that nominal yields rise only modestly. A seven-year duration inflation-linked gilt might lose roughly seven percent in price from the jump in real yields, partially cushioned by perhaps two or three percent of inflation uplift on their index-linked coupons (cashflows); however, the cushion will take time to take effect as cashflows are typically paid on a semi-annual basis. The equivalent nominal gilt faces only a small rise in discount rates and therefore a far smaller capital (price) loss. In this type of environment, nominal bonds tend to outperform inflation-linked ones even if inflation remains elevated in the data.
The second scenario is a shift in the real economy driven by growth or productivity improvements.
B) Pure real-yield shock (breakevens flat) (inflation views unchanged; the whole move is in ‘real yields’).
Move: ‘real +0.5%’, ‘breakeven 0%’ ⇒ ‘nominal +0.5%’
Inflation linked bond: ≈ −3.5%
Nominal bond: ≈ −3.5%
Here, real yields rise but inflation views do not move much. Breakevens stay flat. Nominals and linkers suffer similar capital losses because the change is entirely a real-rate story.
The third scenario is the one investors associate intuitively with inflation-linked gilts performing well.
C) Inflation scare (breakevens up more than real) (inflation scare/reflation)
Move: ‘real +0.2%’, ‘breakeven +0.8%’ ⇒ ‘nominal +1.0%’
Inflation linked bond: ≈ −1.4%
Nominal bond: ≈ −7.0%
→ Inflation linked bonds win when ‘breakevens’ widen a lot.
In an inflation scare, breakevens rise sharply as the market prices in more inflation ahead, whilst real yields might still increase but do so more gently. The nominal discount rate therefore rises by more and nominal bonds face steeper losses. The inflation linkage in the index-linked gilt, combined with the rising value of inflation insurance, tends to dominate the impact of rising real yields, allowing linkers to hold value or even produce gains. This is the one environment where inflation-linked assets deliver the hedge that investors hoped they would provide: when inflation risk is greater than initially priced in, not when it is merely already high and well priced.
The arithmetic behind these differences is not theoretical hand-waving. Take a single £100 cashflow due seven years from now. Discounted at one percent real yield it is worth roughly £93 today (£100 ÷ 1.01 ^ 7 ≈ £93). Raise the real discount rate to two percent and that value falls to around £87 (£100 ÷ 1.02 ^ 7 ≈ £87). That is the capital mathematics that drives inflation-linked gilt performance: real yields up, prices down. The RPI indexation that investors intuitively focus on simply takes time to arrive and is rarely strong enough to neutralise rapid repricing.
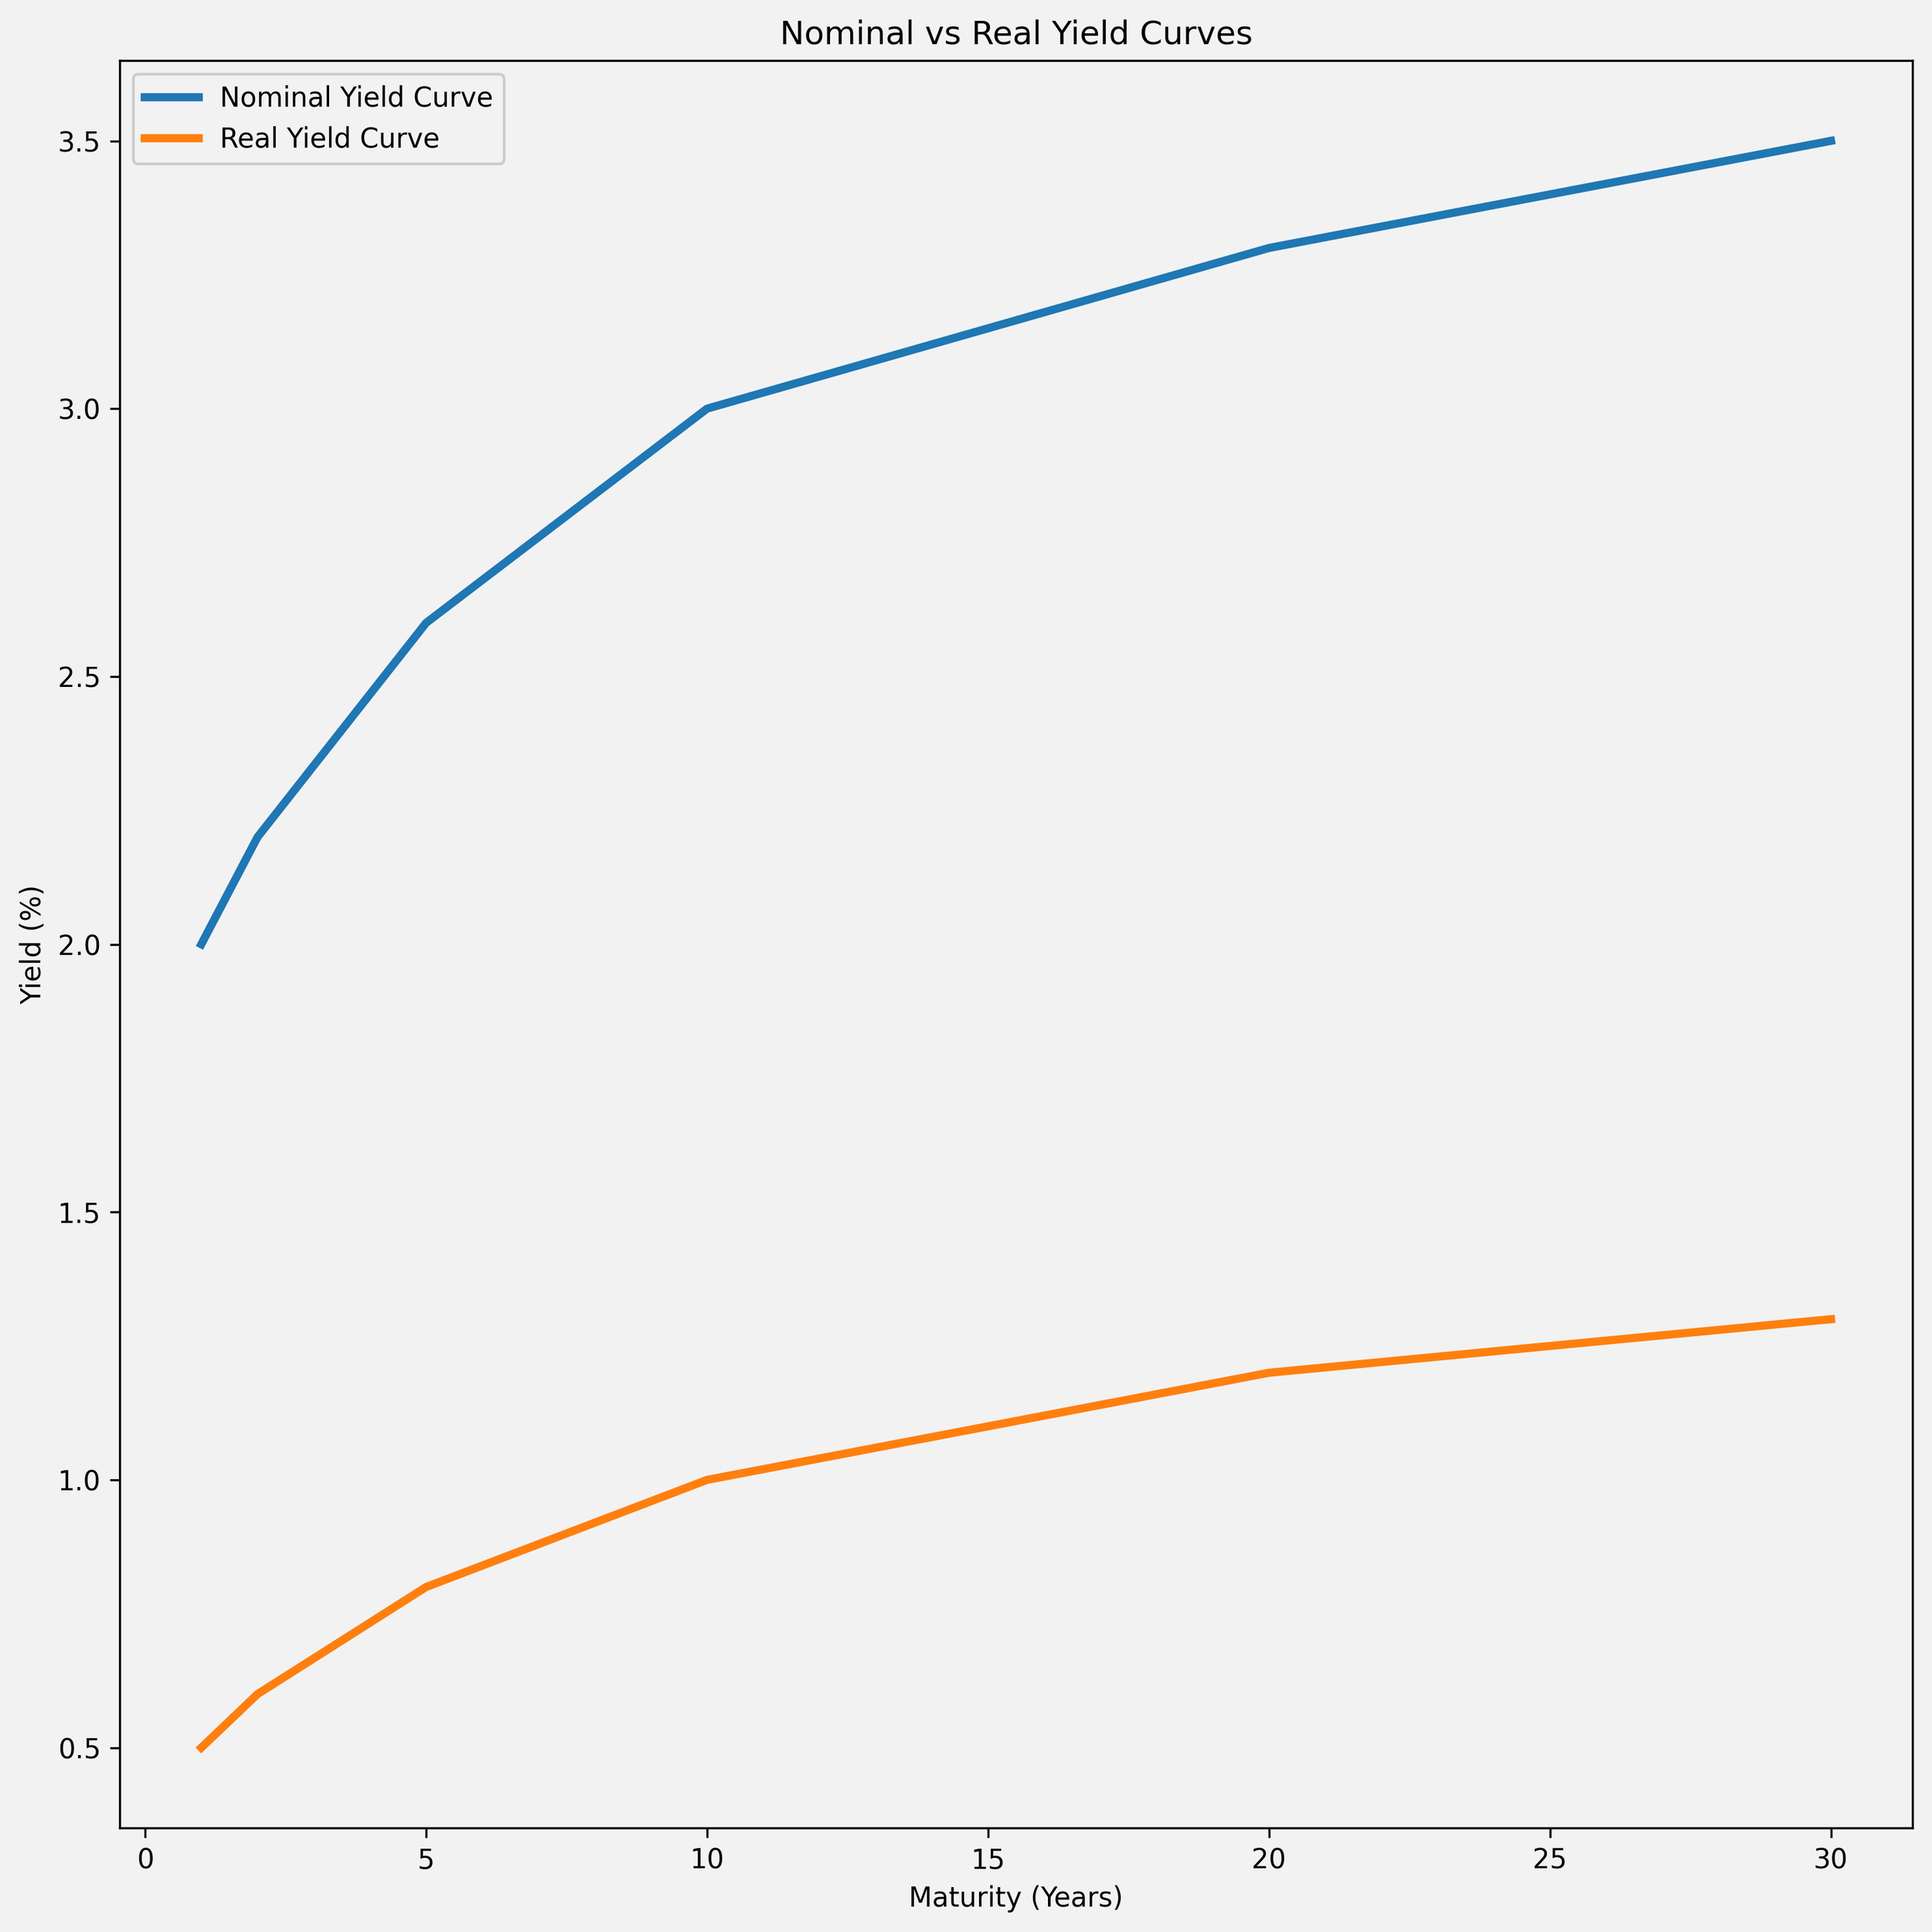
Figure 2. This chart shows an illustrative example of the nominal and real gilt yield curves across different maturities. Both slopes rise gradually as maturities extend, reflecting the higher returns investors usually require for locking up money for longer time horizons. The real yield curve sits noticeably below the nominal one because index-linked gilt cashflows are already protected against inflation, so the quoted yield represents a return after inflation has been accounted for. The vertical gap between the two curves is the breakeven inflation rate, which reflects the market’s view on future inflation along with the value placed on inflation protection. Taken together, the two curves highlight how the market separates the real return investors demand from the compensation they expect for inflation.
Gilt vs Index-Linked Gilt Cash Flows Under Different Inflation Scenarios
The duration examples above describe what can happen to market prices before maturity.
A separate analysis is needed to understand the cash flows and returns received by an investor who purchases a bond at a given yield and holds it to maturity.
Consider a simplified five-year comparison between a conventional gilt and an index-linked gilt.
Assumptions
Par value = £100
Coupon rate = 0.25%
Maturity = 5 years
Nominal yield = 4.3%
Real yield = 0.5%
Break-even inflation = 3.8%
For simplicity, the example below shows annual rather than semi-annual cash flows and assumes a constant annual inflation rate. Actual gilt calculations use semi-annual coupons, index ratios and the relevant indexation lag.
At a nominal yield of 4.3%, a five-year conventional gilt paying a 0.25% annual coupon would have an approximate purchase price of £82.12.
At a real yield of 0.5%, the corresponding index-linked gilt would have an approximate real purchase price of £98.77.
The linker’s nominal cash flows then depend on the inflation that is actually realised.
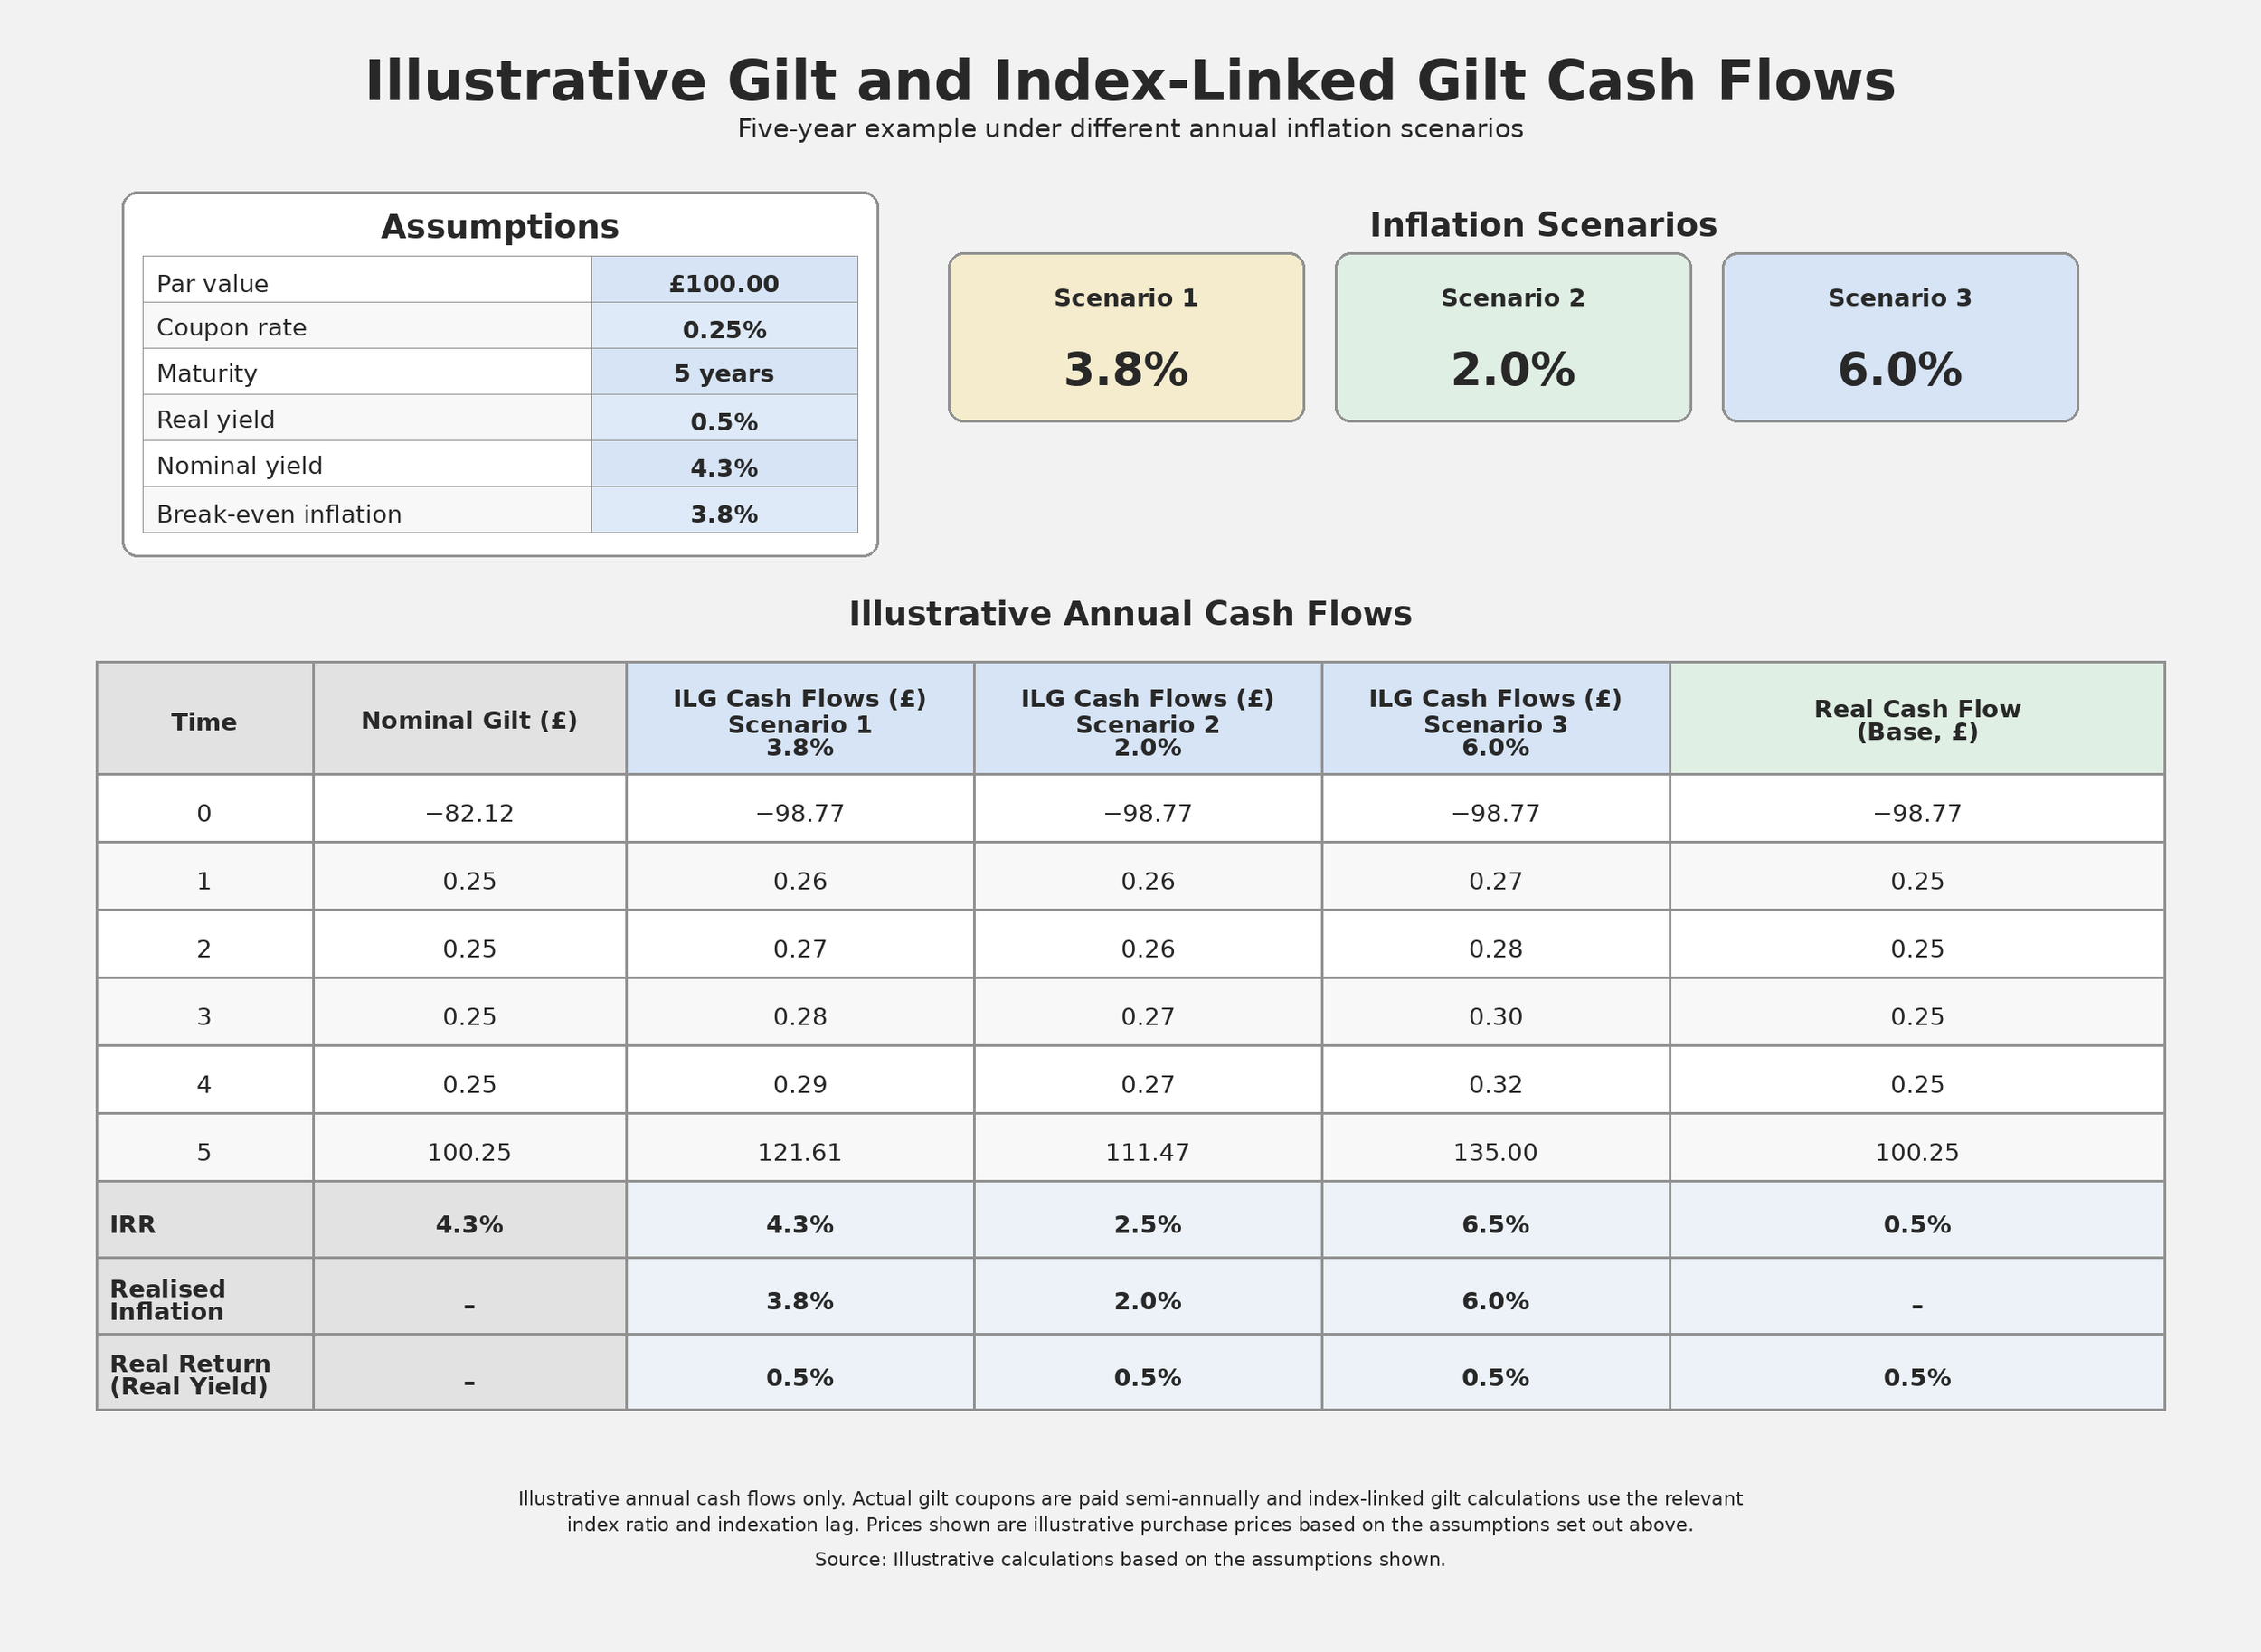
Figure 3. Gilt vs ILG cashflows under various scenarios.
Scenario One: Inflation Equals Break-Even
Suppose inflation averages 3.8%, exactly equal to the break-even rate priced when the bonds were purchased.
The conventional gilt delivers an internal rate of return of approximately 4.3%.
The index-linked gilt also delivers a nominal internal rate of return of approximately 4.3%:
Real return of approximately 0.5%
Plus inflation of approximately 3.8%
Equals a nominal return of approximately 4.3%
The investor is therefore approximately indifferent between the two bonds.
This is the meaning of break-even inflation. It is the inflation rate at which appropriately matched nominal and index-linked gilts should deliver broadly equivalent returns if purchased at the stated yields and held to maturity.
Strictly speaking, the exact relationship is multiplicative rather than additive:
(1 + Nominal return) = (1 + Real return) × (1 + Inflation)
However, the additive relationship is a useful approximation at relatively modest rates.
Scenario Two: Inflation Is Below Break-Even
Suppose realised inflation averages 2.0%.
The conventional gilt still delivers its original nominal yield of approximately 4.3%, assuming it is held to maturity and the issuer meets its obligations.
The linker delivers a nominal return of approximately 2.5%:
Real return of approximately 0.5%
Plus inflation of approximately 2.0%
Equals a nominal return of approximately 2.5%
The nominal gilt performs better.
The linker investor purchased protection against inflation that subsequently proved less valuable than the market had priced in.
Scenario Three: Inflation Is Above Break-Even
Suppose realised inflation averages 6.0%.
The nominal gilt continues to deliver approximately 4.3%.
The linker delivers a nominal return of approximately 6.5%:
Real return of approximately 0.5%
Plus inflation of approximately 6.0%
Equals a nominal return of approximately 6.5%
The linker performs better because realised inflation exceeds the break-even rate priced at purchase.
The Broad Relationship Is Therefore:
If:
Realised inflation = Break-even inflation
Nominal and index-linked gilts deliver approximately equal returns.
If:
Realised inflation < Break-even inflation
The nominal gilt delivers the higher return.
If:
Realised inflation > Break-even inflation
The index-linked gilt delivers the higher return.
Taking Stock
Let us take a moment to return to the root of confusion. Advisers and investors often believe that index-linked gilts are a pure hedge against inflation. Yet the breakeven curve already reflects the market’s inflation expectations. A linker is not protection against current, priced in (expected) high inflation. It is protection against inflation surprising to the upside compared with what the market has already priced in. In a world where central banks aggressively tighten policy and inflation expectations are pulled lower, index-linked gilts may deliver negative returns as the real rate increases.
Whether linkers appear expensive or cheap depends on who is looking. A pension fund that cares about matching long-dated real liabilities values the inflation hedge more than the headline yield figure. A total-return investor may judge negative real yields and tight hedging premia to be unattractive. What appears to be mispricing is often just the market expressing differing degrees of concern about inflation uncertainty.
The nominal and real yield curves provide two critical signals: how much compensation investors require after inflation and how much inflation they think they will be exposed to. The gap between the two will always be noisy because the value of inflation protection and unexpected inflation varies through time. But understanding how those components move through different macroeconomic shocks is essential. Inflation-linked gilts hedge unexpected high inflation, not interest rate risk. They outperform when inflation uncertainty rises dramatically and underperform when real yields reprice higher. Recognising that distinction can be the difference between using index-linked gilts as a powerful insurance instrument and being disappointed when they behave exactly as they should.