The Main Components of Bond Returns: Carry, Roll-down, and the Yield-curve Surprise
Bond returns can appear deceptively simple: you lend money to a government or corporation, receive regular coupon payments, typically semi-annually, and are repaid your principal at maturity. Deceptively simple, until you try to explain why a ‘safe’ asset can produce a three month negative return of 20.14%… even when it is paying a perfectly good coupon*. To understand a bond’s total return, it is helpful to think about it as a blend of (1) what you get paid for holding it, (2) what you might gain simply because time passes on an upward-sloping curve, and (3) the part you cannot forecast, namely how yields change through time versus what today’s yield curve implicitly assumes. Put differently, bonds have an ‘expected’ return component, carry and roll-down, and a ‘shock absorber’ component, the yield-curve surprise.
A useful mental model is:
Bond return ≈ Carry + Roll-down + Yield-curve surprise
Carry and roll-down represent the expected return components implied by today’s yield curve, assuming its shape evolves smoothly through time. The yield-curve surprise captures the unexpected component of returns arising from changes in the slope of the yield curve, and can dominate realised outcomes over shorter time horizons.
*This scenario occurred with the Vanguard UK Long Duration Gilt Index Acc fund from 31st July to 31st October 2022 (Morningstar 2025).
Duration
Before we begin explaining bond returns and their component parts, it is important to be clear about what duration is. Duration is the standard way bond investors summarise interest-rate sensitivity. In plain terms, it tells you how much a bond’s price is likely to move when yields change.
The most useful version for intuition is modified duration, which is a first-order approximation of the percentage price change for a 1 percentage point move in yield.
Two practical points matter for readers. First, duration rises with time to maturity and falls with higher coupons (because more of your principal lent is returned faster). Second, duration is not a guarantee: it is an approximation that works best for small yield moves and ignores convexity (the fact that the price–yield relationship is curved), but it is still the cleanest single number for explaining why ‘safe’ bonds can have very volatile years when rates move sharply.
Duration and Why It Shows Up Everywhere
Under the hood, a bond price is the present value of its cash flows. In simple form:
P(y) = Σ CF_t / (1 + y)^t
Where:
P(y) = the price of the bond as a function of yield.
∑ = the sum over all future cash-flow dates.
t = time (in years) until each cash flow is received.
CF_t = the cash flow received at time t (coupon payments during the life of the bond, plus principal at maturity).
y = the bond’s yield to maturity (expressed as a decimal, e.g. 0.03 for 3%).
(1+y)^t = the discount factor that converts future cash flows into today’s money.
Differentiate that with respect to yield and you get the core intuition behind duration: duration measures how sensitive the price is to a small change in yield. Formally, modified duration is often defined as:
D = -(1/P) × (dP/dy)
Where:
D = modified duration.
P = the current bond price.
dP/dy = the derivative of price with respect to yield, i.e. how much the price changes for a very small change in yield.
The minus sign (−) = reflects the inverse relationship between price and yield (when yields rise, prices fall).
In practical terms, a bond with a duration of 5 will lose roughly 5% of its value if yields rise by 1 percentage point, for example from 3% to 4%.
This is why, in practice, a lot of bond return decomposition collapses into a very handy approximation:
Return ≈ Yield income - D × (±Δy)
Another way to think about the above equation is to say that the bond’s return equals the yield ± the capital return. Again, this is not a perfect identity and ignores convexity, non-parallel curve moves, reinvestment of coupons, and roll-down. But it is directionally right, and it explains why bonds can disappoint even when their yields look attractive.
1) Carry or Income: ‘Get Paid for Just Holding It’
Moving on to explain the component parts of bond returns, we start with carry. Carry is what you earn if nothing moves. Imagine you freeze the world in place: yields do not change, credit spreads do not change, and the yield curve does not shift. Over the next year, what do you get simply for owning the bond?
For a plain vanilla domestic bond, carry is mostly the coupon cash flows plus the pull-to-par effect (if you bought at a discount or premium). In practice, people often approximate carry using yield because yield is a summary of the income you lock in from today’s pricing. For a foreign currency (FX) hedged foreign bond, carry can also include the hedge carry, which is the return you earn or pay through the FX forward (driven largely by the interest-rate differential embedded in forward points). The mechanics of FX hedging change the currency risk, but the interest-rate engine underneath is the same: if yields and prices ‘just froze where they are today’, carry is the return you would expect to collect.
2) Roll-down: ‘Gliding Down the Curve’
Roll-down is a subtle one, and it only makes sense once you separate ‘time passing’ from ‘rates changing’. Suppose the yield curve keeps the same shape and level, but a year goes by. Your 5-year bond becomes a 4-year bond, your 2-year becomes a 1-year, and so on.
If the curve is upward sloping, shorter maturities usually have lower yields. So as your bond ‘slides’ towards the short end, the yield that would be demanded for that now-shorter maturity is lower. A lower yield implies a higher price. That price gain is the roll-down return.
This is why investors running a constant-maturity strategy (for example always holding ‘about 5 years’ of duration) often talk about harvesting both carry and roll-down. The typical implementation is: hold a bond that starts at 5 years, let it age to 4 years, then sell it and buy a new 5-year bond. If the yield curve shape does not change, you keep the realised price gain from the bond rolling down the curve. You do not ‘give it back’ when you rebuy. What you give up is simply the fact that the new 5-year bond is priced to yield more than a 4-year bond because it sits further out on the curve. That is exactly why you can potentially repeat the process: higher yield out the curve, plus the possibility of rolling down again, if the curve stays upward sloping and reasonably stable.
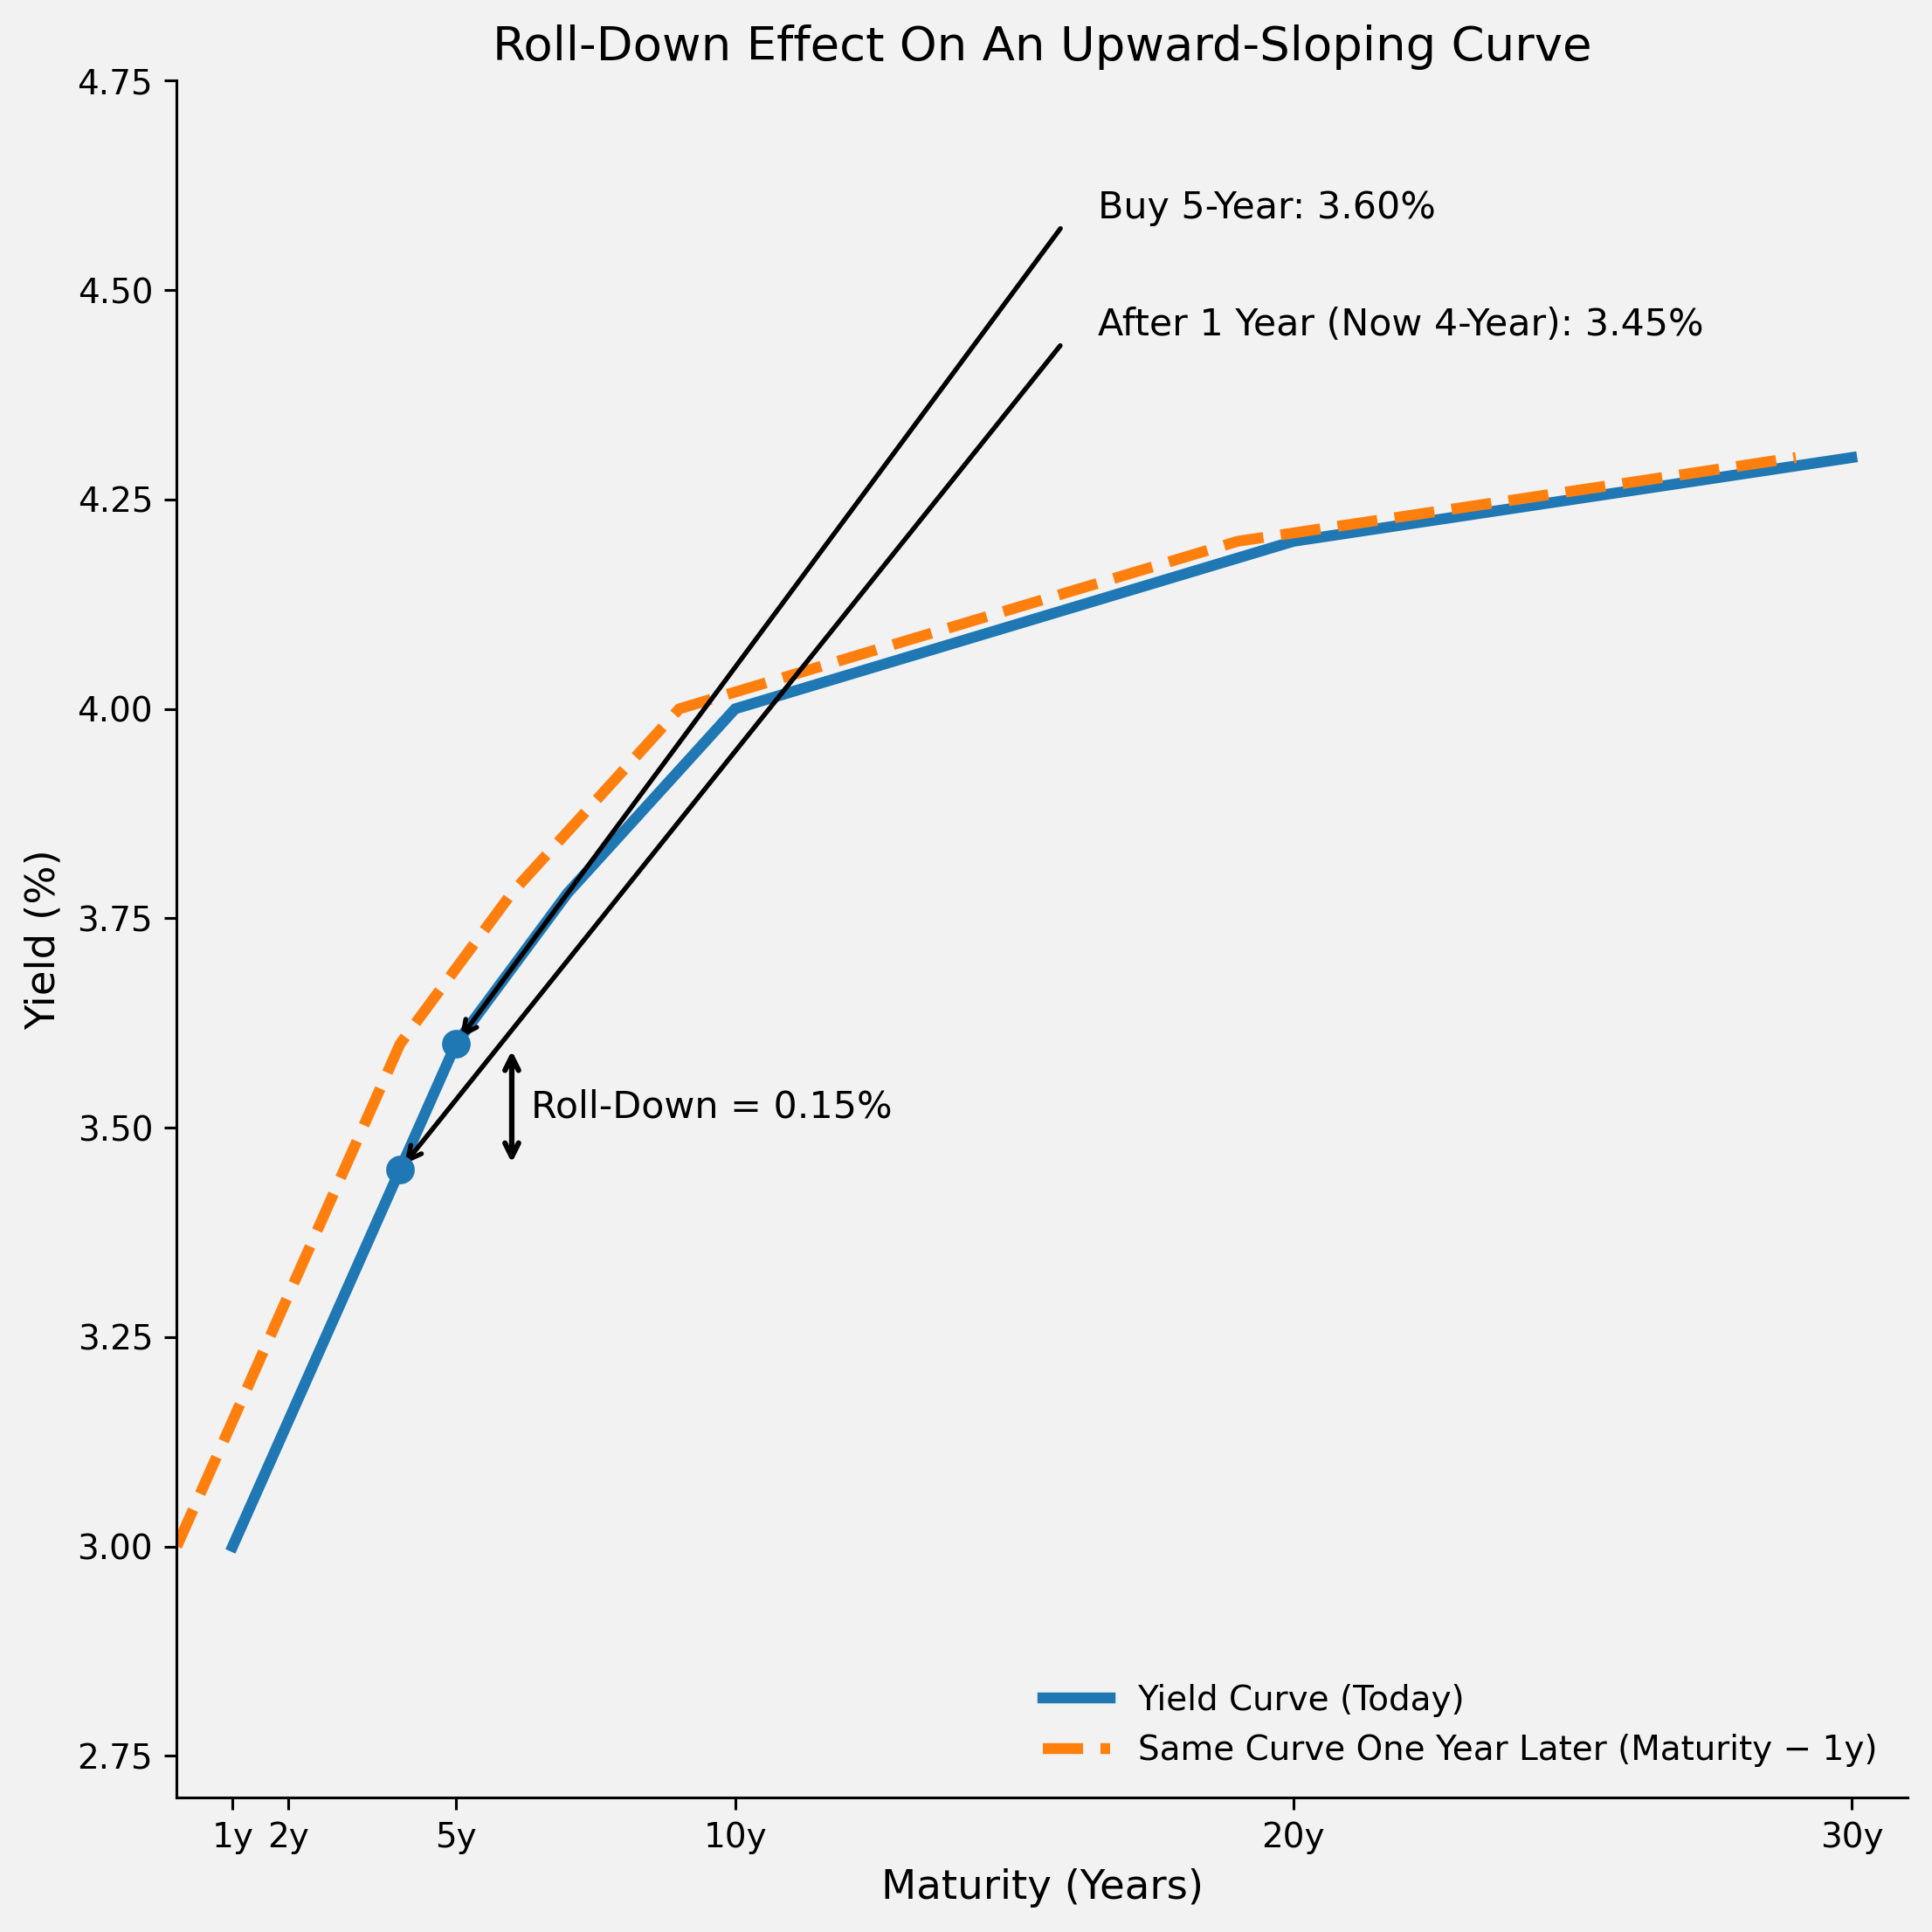
Figure 1. Explaining the concept of roll-down.
The chart highlights a bond bought at 5 years to maturity and, one year later, the same bond now being a 4-year. Because the curve slopes upwards, the 4-year yield is lower than the 5-year yield, shown by a vertical double-headed arrow labelled ‘Roll-Down’. That yield drop is the intuition behind roll-down: as the bond ‘slides’ down the curve to a shorter maturity, its yield tends to fall, which implies a price rise (a capital gain), all else equal.
3) The Yield-curve Surprise: ‘What the Curve Actually Does’
Now for the risky bit, and this is the one that tends to dominate headlines. The yield-curve surprise is the extra capital gain or loss from the curve ending up somewhere different from where today’s curve implied it would be.
Today’s curve is not just a picture of current yields. It is also a rough, market-implied statement about the future path of interest rates, term premia, and risk pricing. If next year’s realised curve is higher, lower, steeper, flatter, or kinked in a different place than what was implicitly priced today, your bond price will adjust. That adjustment is the surprise component.
This is where duration bites. A first-order approximation for the percentage price change from a yield move is:
%ΔP ≈ -D × Δy
Where:
%ΔP = percentage change in the price of the bond.
D = modified duration.
Δy = change in yield in decimal terms.
If yields rise, prices fall. If yields fall, prices rise. Bigger duration means bigger sensitivity.
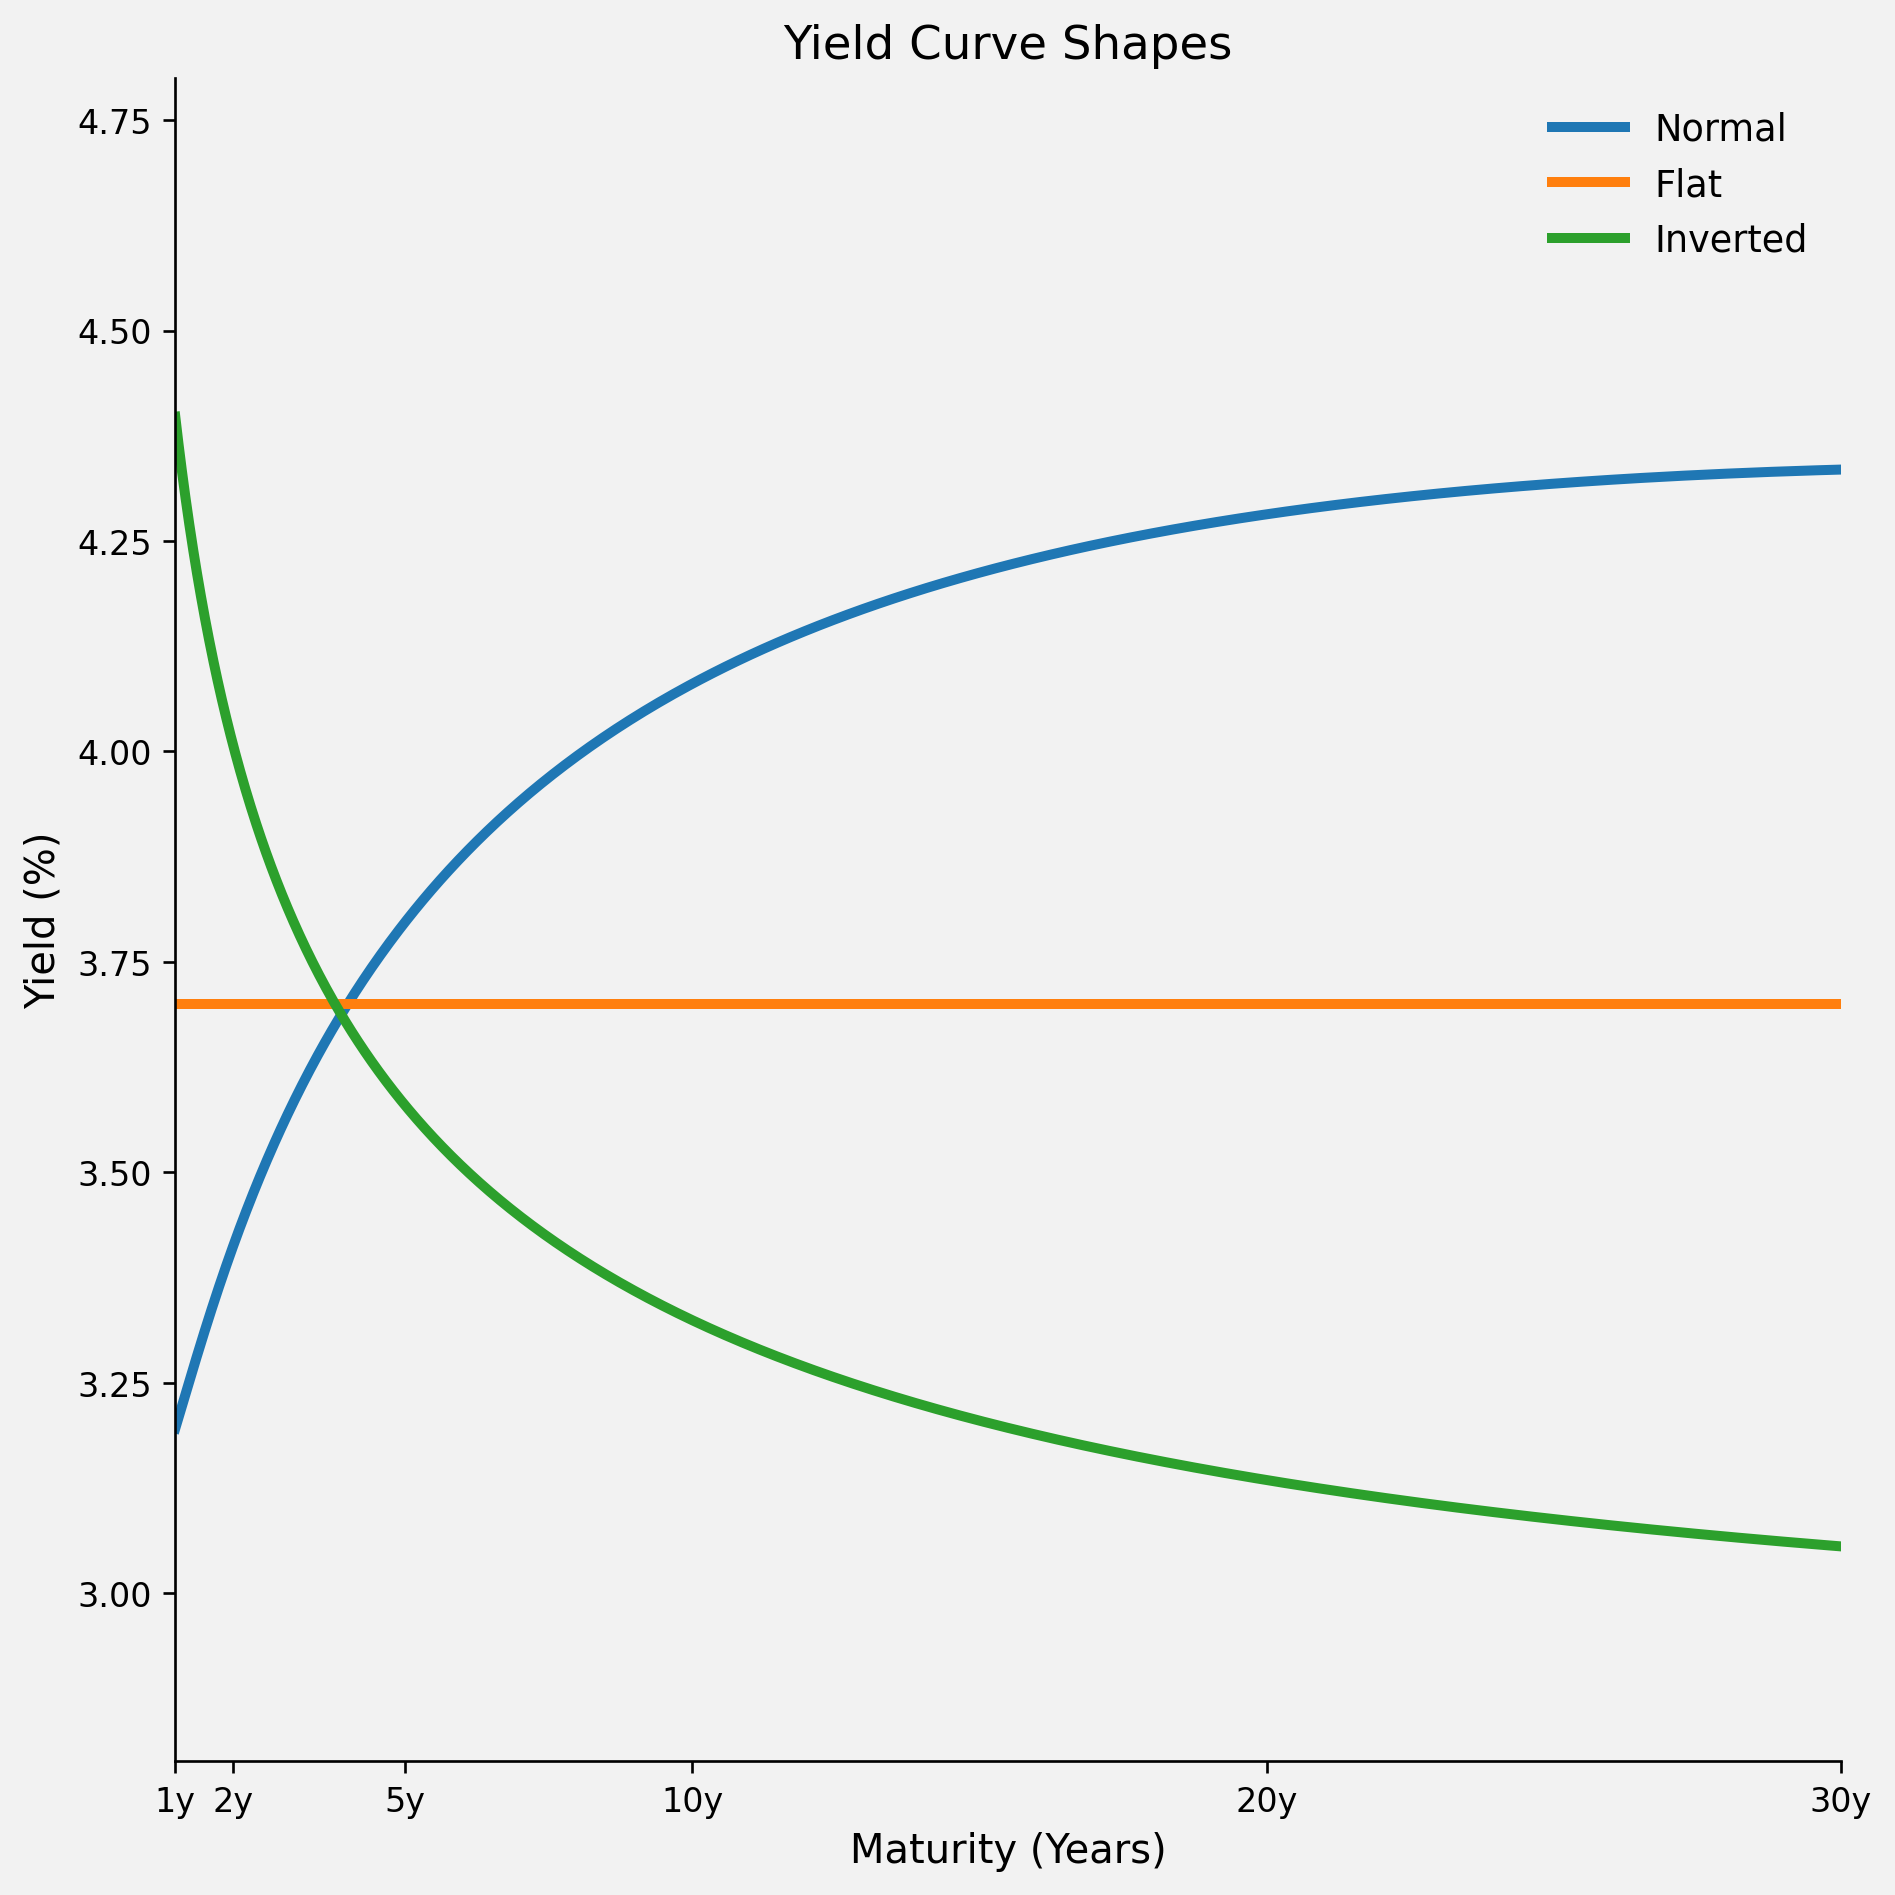
Figure 2. An illustrative example of different shapes of yield curves.
The chart shows yield (%) on the Y axis and maturity in years on the X axis (1y, 2y, 5y, 10y, 20y, 30y). Each line is a different shape that the yield curve can take:
Normal curve (upwards sloping): yields are lower at short maturities and higher at long maturities. The line rises from left to right. The intuition is that investors usually demand a higher yield to lend for longer because longer maturities carry more inflation and interest-rate (duration) uncertainty (a positive term premium).
Flat curve: yields are roughly the same across maturities. The line is close to horizontal. Normally, longer bonds carry a positive term premium (extra yield for duration and inflation uncertainty). In a flat curve, that premium is small, or it’s being offset because investors are willing to accept less extra yield (pay a higher price) to lock in longer rates (often when uncertainty is high and there’s demand for ‘safe’ duration).
Inverted curve (downwards sloping): yields are higher at short maturities and lower at long maturities. The line falls from left to right. The intuition is that longer-term bonds’ prices are bid up as there is higher demand for this ‘safer’ investment as investors do not feel that they can get a better-returning investment for a given level of risk tolerance. Shorter-term bond prices may also be bid up as investors move out of riskier assets like stocks but this will not be to the same extent as longer-dated bonds. Remember, in equilibrium the return of both, i.e., price returns and coupon payments should be equal for both at maturity and prices must reflect this. Therefore, an inverted yield curve suggests investors have low confidence in the economy and that they expect central banks will soon need to cut interest rates in response to a recession.
A Simple Example of the Yield-curve Surprise
Consider a bond with a duration of D = 5
If yields rise by 2 percentage points, then:
Δy = +0.02
The duration-based price impact is:
−D × Δy = −5 × 0.02 = −0.10
That is, an approximate 10% capital loss. If the bond’s yield income over the period is 4%, the return implied by the approximation is:
Return ≈ 0.04 − 0.10 = −0.06
or −6%.
If instead yields fall by 2 percentage points:
Δy = −0.02
then:
−D × Δy = −5 × (−0.02) = +0.10
producing an approximate 10% capital gain.
Return ≈ 0.04 + 0.10 = 0.14
or +14%.
Putting It Together for Hedged Bonds
When people say ‘hedged bond returns’, they usually mean FX risk is hedged back to the investor’s home currency. That removes the currency noise, but it does not remove interest-rate risk. The interest-rate mechanics are still governed by duration and yield changes. Conceptually, you can think of:
Hedged return ≈ (Bond carry including coupons) + (Hedge carry) + (Price change from yield moves).
So hedging is not a magic shield against interest-rate losses. It is a shield against FX swings. The yield-curve surprise still comes through loud and clear.
When Roll-down ‘Bites’
Roll-down and carry look especially tempting when the yield curve is upwards sloping. You can point at a longer maturity and say: ‘I get a higher yield, and if the curve stays put I might also get a bit of capital gain as the bond ages.’ That is all true, conditional on the curve behaving.
But the same duration that makes roll-down possible also amplifies losses when yields rise unexpectedly. If yields rise by more than the slope you were hoping to ‘glide down’, the price loss can overwhelm both carry and roll-down. In that sense, roll-down is not a free lunch. It is a bonus that shows up only if the yield-curve surprise does not go the wrong way.
Two ‘It Bites’ Scenarios
Consider a simple setup where 1-year bills yield 3% and a 3-year bond yields 4%. You buy the 3-year bond for the extra carry and the possibility of roll-down. In the nice world where the curve stays unchanged, you might expect around 4% income plus a modest roll-down gain as the bond shortens, maybe ending up near 5% total for the year.
Now imagine inflation surprises and the central bank hikes more than the market expected. If all yields rise by about 1%, your 3-year bond’s yield goes from 4% to 5% and the price falls by roughly 3% because duration is about 3. Your realised return becomes about 4% income minus 3% price loss, or roughly +1%. Cash at 3% outperforms. The extra yield and hoped-for roll-down did not disappear, but they were swamped by the yield-curve surprise.
A second scenario is where short rates barely move but longer rates rise. Suppose 1-year is 3%, 5-year is 4%, and you run a constant 5-year strategy expecting carry plus roll-down. If the 5-year yield jumps to 5% whilst the short end is stable, the duration hit is around 4% to 5% on price, roughly offsetting the 4% income and leaving you near flat or slightly negative. Meanwhile the 1-year earns about +3% with minimal price risk. Again, it is not that roll-down was an illusion, it is that the yield curve did something different from what you were counting on.
Conclusion
Carry and roll-down can be genuine sources of expected return, especially on an upwards-sloping curve. But the yield-curve surprise is the dominant risk, and duration is the amplifier. A compact way to remember it is:
Bond return ≈ Carry + Roll-down + Yield-curve surprise
Carry is ‘get paid for just holding it’. Roll-down is ‘gliding down the curve’. The surprise is ‘what the curve actually does’. And the uncomfortable truth is that the surprise can easily overwhelm the first two, which is exactly why bond returns can look calm for years and then suddenly feel very equity-like when yields reprice.
References
Morningstar. 2025. Database. Accessed 19th December 2025.