The Hidden Costs of Indexing: What Investors Should Understand
Index investing is rightly celebrated for its low costs, transparency, and broad diversification. For most investors, it remains the best approach to building long-term wealth. However, many discussions stop at highlighting the low ongoing charges figure (OCF), without addressing the hidden frictions that can quietly erode returns. These costs are not a reason to abandon indexing, but understanding them helps investors set more realistic expectations.
This article highlights the key hidden costs of index investing, explains when they can be more pronounced, and explores why more flexible systematic approaches, such as those used by Dimensional Fund Advisors, can deliver a more efficient form of market exposure.
Adverse Selection in Index Construction
Adverse selection occurs when weaker participants stay in a system while stronger ones leave (Akerlof 1970). In index investing, adverse selection manifests in several ways:
Company removals: Companies are often dropped from an index after their financial health has deteriorated, meaning index funds sell at already depressed prices.
Company additions: Newly added companies typically experience a price spike, forcing index funds to buy at inflated valuations (Chen, Noronha, and Singal 2004).
Sector concentration: Indexes naturally overweight sectors that have recently performed well, increasing exposure to sectors potentially at the peak of their cycle.
Thus, while passive, index funds are not insulated from selection risks.
Key Hidden Costs of Index Investing
Beyond the OCF, several hidden costs quietly reduce returns. These costs vary over time and market conditions but are real and measurable.
1. Forced Trading at Unfavourable Prices
Index funds must buy and sell stocks immediately upon changes to the index. Traders often front-run these transactions, driving prices up before additions and down before removals, extracting value from index funds (Wurgler 2010).
2. Turnover Costs
Even ‘low turnover’ funds must trade:
Crossing bid-offer spreads
Paying brokerage commissions
Bearing minor market impacts
These costs may be small individually but compound materially over long periods.
3. Reconstitution Drag
Regular rebalancing events — where indexes update their constituents — create concentrated trading volumes. Studies show that during these periods, prices can temporarily spike or dip, costing index funds in the process (Madhavan 2003).
4. Limited Trading Flexibility
Traditional index funds like VTI must replicate index changes without discretion, even if valuations are unfavourable. In contrast, systematic strategies like Dimensional’s can delay or adjust trades to avoid poor prices (Arnott, Hsu, and Moore 2005).
5. Liquidity Constraints
Many small-cap stocks are illiquid. Large forced trades in these stocks can incur significant slippage — the difference between the expected price of a trade and the actual price at which the trade is executed. This is emphasised during stressed markets when liquidity dries up (Madhavan 2003).
6. Sector Concentration Risk
Market-cap-weighted indexes increasingly overweight booming sectors, creating exposure risks if those sectors subsequently underperform. Investors are not consciously making these bets but are dragged along by market trends.
7. Event-Driven Distortions
Large, high-profile events, such as Tesla’s inclusion in the S&P 500 in December 2020, can exacerbate hidden costs:
Tesla’s stock price rose ~70% between announcement and inclusion.
Index funds had no choice but to buy at elevated levels.
Subsequent underperformance affected passive fund returns.
Estimates suggest a collective cost of £4–8 billion for index investors due to this event alone (Hammond 2021).
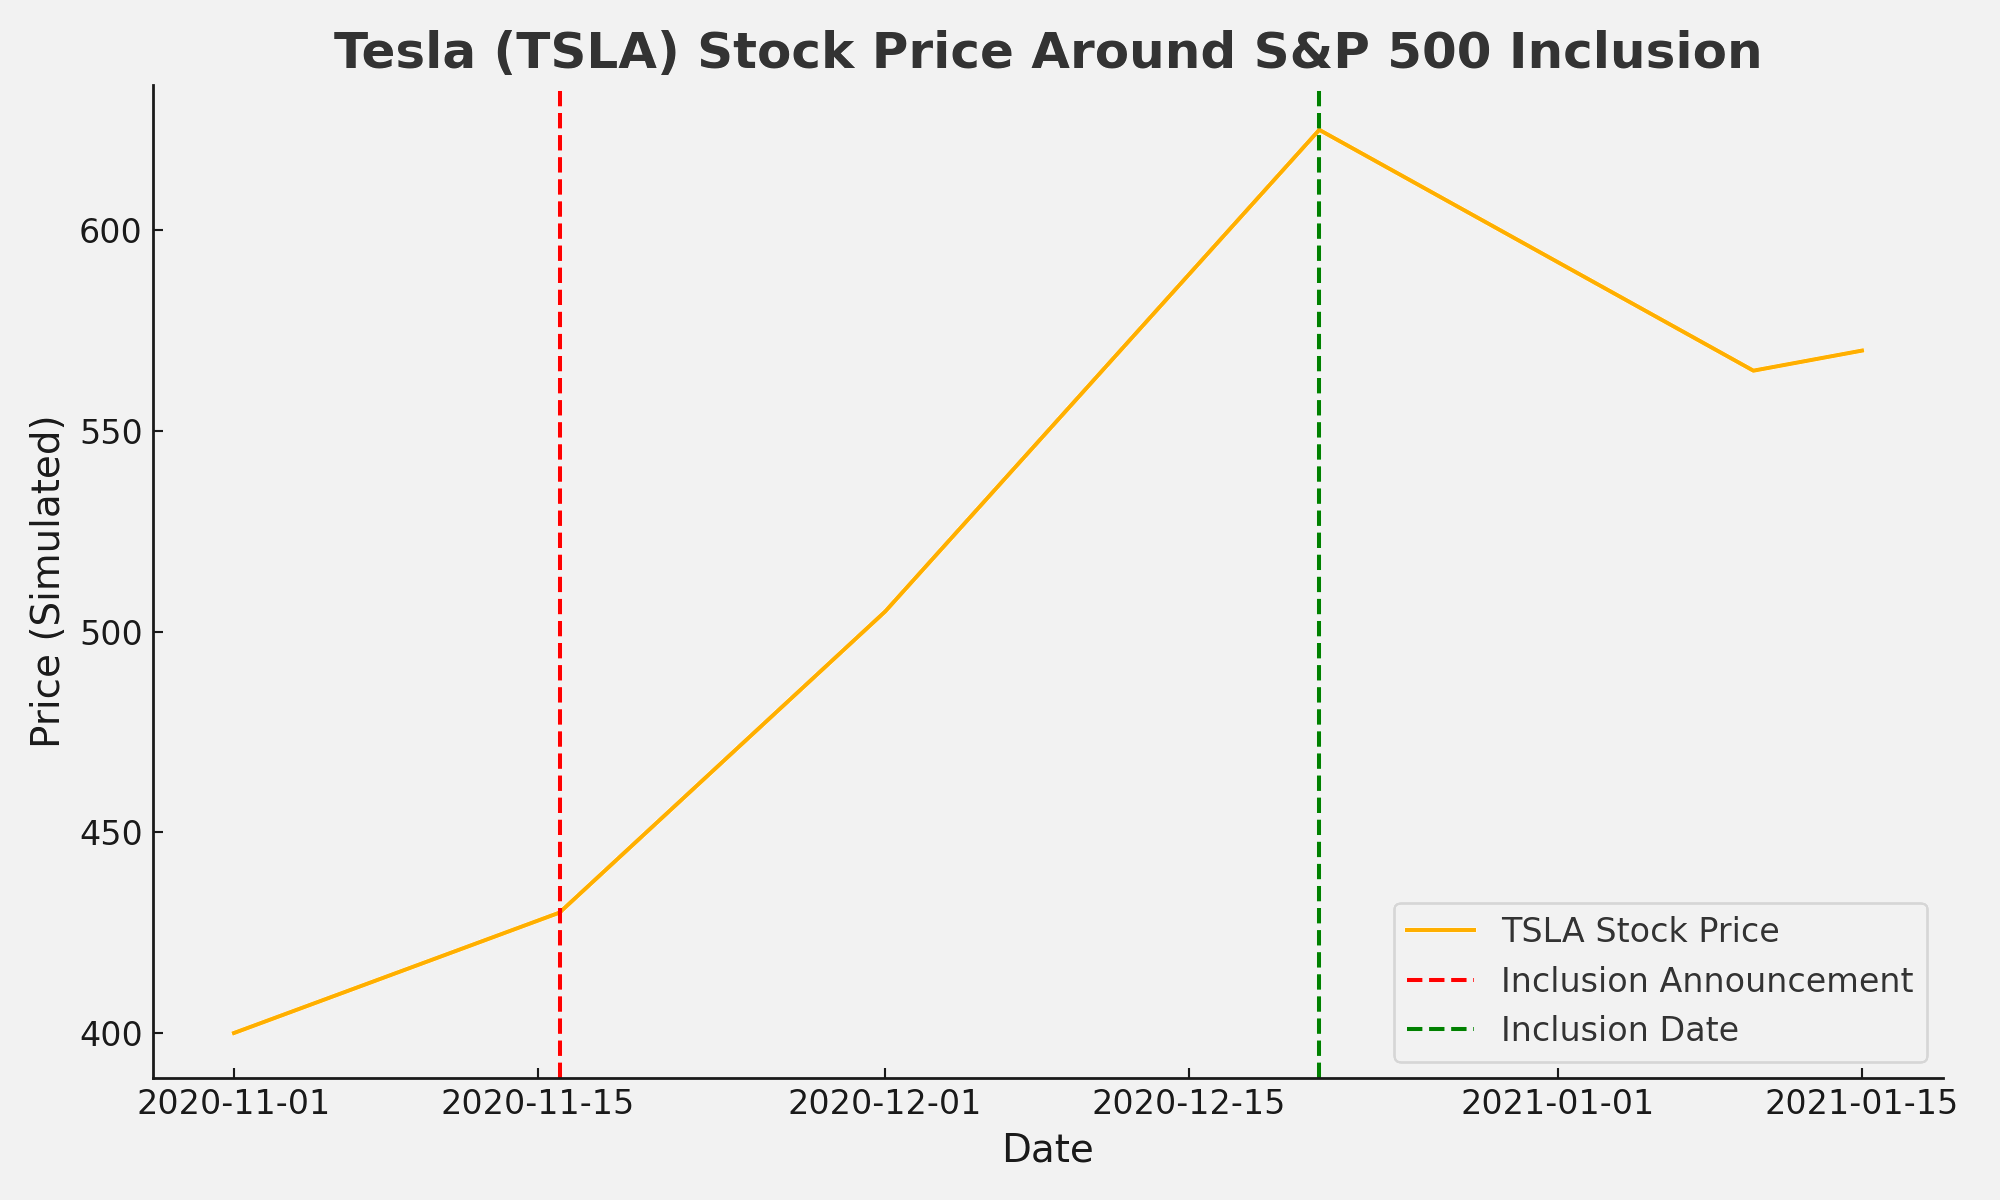
Figure 1. This chart shows the movement of Tesla’s stock price from November 2020 to January 2021, centred around its announcement and official inclusion into the S&P 500 index.
The red dashed line marks November 16, 2020, when it was publicly announced Tesla would join the index.
The green dashed line marks December 21, 2020, when Tesla was officially added.
Following the announcement, Tesla’s stock price surged sharply, illustrating how forced buying by index funds (and front-running by traders) inflated Tesla’s valuation ahead of inclusion. After the inclusion date, the stock's momentum stalled, highlighting the hidden costs passive investors often face during major index rebalances.
Why Hidden Costs Can Vary
Hidden costs are not static. They increase during:
Major index reconstitutions: When many stocks are added or removed simultaneously (Madhavan 2003).
Low liquidity periods: Market stress or crises reduce liquidity, increasing trading costs (Petajisto 2011).
Large-cap inclusions: The bigger and more famous the company, the larger the distortion, as seen with Tesla.
Sector booms and busts: Sector overconcentration risks magnify hidden frictions during reversals.
In calm markets, hidden costs may be between 0.05% to 0.15% annually (Gerakos, Linnainmaa, and Lo 2023); in turbulent times, they can spike much higher.
VTI vs Dimensional: A Closer Comparison
How VTI Works
VTI (Vanguard Total Stock Market ETF) tracks the CRSP US Total Market Index by:
Holding nearly every publicly traded US stock.
Mechanically buying and selling to match changes in the index.
Maintaining a strict market-cap weighting, meaning larger companies dominate the portfolio.
Trading rigidly when companies enter or exit the index, regardless of price.
Keeping extremely low fees (OCF ~0.03%).
✅ Strengths: Simplicity, low visible cost, broad exposure.
🚫 Hidden weaknesses: Forced trading, adverse selection, turnover costs, liquidity drag in small-cap stocks, sector concentration risk.
How Dimensional Works
Dimensional, through funds like DFUS (US Core Equity 2 Portfolio):
1. No rigid rules — only flexible guidelines
Dimensional funds don't strictly follow an external index (like S&P or CRSP).
Instead, they define a ‘universe’ of stocks they want to own (e.g., US-listed companies, across large, mid, small caps).
If a stock becomes slightly bigger or smaller, or moves into or out of another fund’s formal index, Dimensional doesn’t have to react immediately.
➔ Result: They avoid forced trades at bad times.
2. Patient, opportunistic trading
Dimensional has the freedom to wait days or even weeks to buy or sell a stock if the price isn’t right.
If sellers are desperate, Dimensional can sit back and offer lower bids.
If buyers are desperate, they can sell at higher offers.
➔ Result: They earn a small trading profit rather than paying a trading cost.
3. Chunk trading and crossing
They often trade in large blocks directly with other institutions, avoiding public markets where prices can move against them.
They also ‘cross trades’ internally (e.g., swapping shares between Dimensional funds instead of selling on the open market).
➔ Result: Much lower trading costs.
4. No public announcements = no front-running
Unlike public index reconstitutions (like S&P 500 changes), Dimensional doesn’t publicly announce trades.
No one knows what Dimensional plans to buy or sell on a given day.
➔ Result: They’re harder to front-run compared to passive index funds.
5. Smoother rebalancing
Instead of reacting all at once on a single ‘reconstitution day,’ Dimensional makes small, ongoing adjustments throughout the year.
They might slowly phase in or phase out positions, minimising market impact.
➔ Result: No ‘air pocket’ days where they get a bad fill.
6. Portfolio design absorbs small changes
Their fund design accepts a little ‘noise’, meaning, they don't worry if a company drifts a little outside of a size cutoff for a while.
A stock doesn't have to be dumped immediately if it moves from small-cap to mid-cap or vice versa.
➔ Result: Fewer unnecessary trades = lower hidden costs.
✅ Strengths: Systematic exposure to higher-returning dimensions, lower hidden trading costs, better liquidity management, still relatively low fees compared to discretionary active fund managers.
🚫 Trade-offs: Slightly higher OCF (typically ~0.20%-0.30%), modest tracking error relative to market-cap benchmarks.
Why Dimensional May Be More Optimal
While VTI’s frictional costs are modest (0.05–0.15% annually), Dimensional’s flexible approach helps avoid the biggest hidden cost spikes, especially during stressed markets or major index events. Research suggests that flexible, systematic investing can deliver more reliable net-of-cost returns over the long term (Gerakos, Linnainmaa, and Lo 2023).
In effect, Dimensional aims to capture market-like returns more efficiently than rigid index funds, without the hidden drags caused by strict mechanical replication.
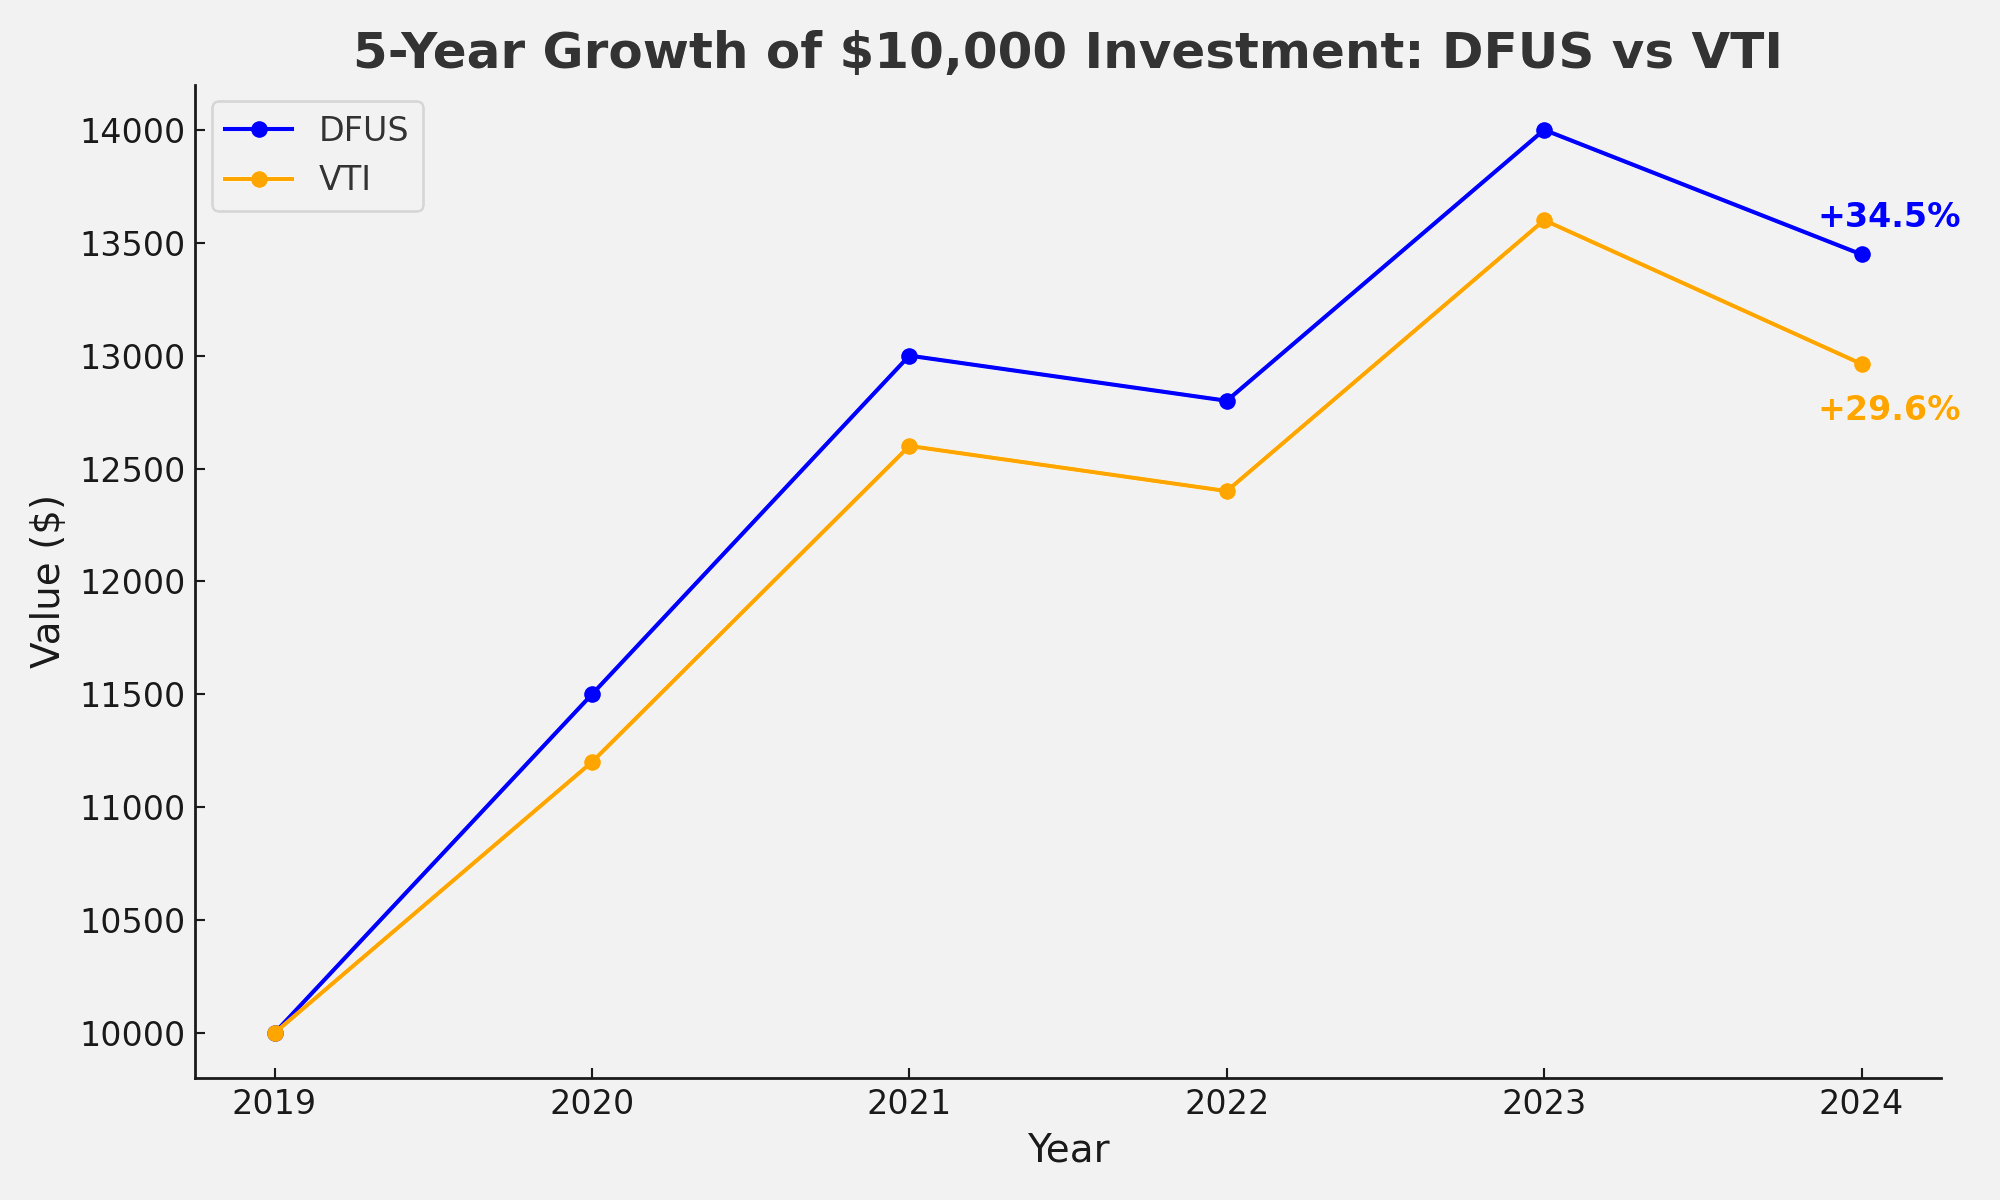
Figure 2. This chart compares the growth of a $10,000 investment in Dimensional U.S. Equity Market ETF (DFUS) and Vanguard Total Stock Market ETF (VTI) over a 5-year period.
DFUS ends with a total return of +34.5%, while VTI trails slightly at +29.6%.
Both funds provide broad exposure to the U.S. equity market, but DFUS applies slight tilts toward smaller and more profitable companies, along with flexible trading strategies to reduce hidden costs.
This outperformance highlights how strategic portfolio design can enhance returns over time, even when tracking similar market segments.
Conclusion
Index investing remains the best strategy for the vast majority of investors. Hidden costs are real but manageable and they are dramatically smaller than the high fees and underperformance risks associated with discretionary active fund management.
Nonetheless, understanding the frictions involved sets better expectations and highlights opportunities for refinement. Strategies like those used by Dimensional Fund Advisors offer a smarter, more flexible form of passive investing, maintaining the benefits while sidestepping many of the avoidable costs.
For investors serious about long-term wealth-building, it pays to dig a little deeper than the headline OCF.
Currently, accessing Dimensional funds in the UK typically requires working with a financial adviser affiliated with DFA. Direct access through standard DIY platforms remains limited. Investors interested in DFA's strategies should consider consulting with a financial professional to explore available options.
References
Akerlof, George A. 1970. ‘The Market for “Lemons”: Quality Uncertainty and the Market Mechanism’ Quarterly Journal of Economics 84 (3): 488–500.
Arnott, Robert, Jason Hsu, and Philip Moore. 2005. ‘Fundamental Indexation’ Financial Analysts Journal 61 (2): 83–99.
Chen, Honghui, Gregory Noronha, and Vijay Singal. 2004. ‘The Price Response to S&P 500 Index Additions and Deletions: Evidence of Asymmetry and a New Explanation’ Journal of Finance 59 (4): 1901–29.
Fama, Eugene F., and Kenneth R. French. 1992. ‘The Cross-Section of Expected Stock Returns’ Journal of Finance 47 (2): 427–65.
Gerakos, Joseph, Juhani T. Linnainmaa, and Andrew W. Lo. 2023. ‘Passive Investing: The Theory, the Evidence, and the Future’ Annual Review of Financial Economics 15: 47–75.
Hammond, Jason. 2021. ‘How Tesla’s S&P 500 Inclusion Highlighted Hidden Costs in Index Funds’ Morningstar, 12 January 2021.
Madhavan, Ananth. 2003. ‘The Russell Reconstitution Effect’ Financial Analysts Journal 59 (4): 51–64.
Petajisto, Antti. 2011. ‘The Index Premium and Its Hidden Costs for Index Funds’ Journal of Empirical Finance 18 (2): 271–88.
Wurgler, Jeffrey. 2010. ‘On the Economic Consequences of Index-Linked Investing’ NBER Working Paper Series no. 16376.