When the Essentials Became a Luxury: The Rise of Intergenerational Inequality
We often hear that living standards have never been higher. In many ways, that’s true. Overseas travel, smartphones, streaming subscriptions, fast fashion, and next-day delivery have become widely affordable. Compared to the mid-20th century, the average worker today has access to a world of consumer goods that even the wealthy didn’t have access to previously.
But this masks a deeper truth: whilst many luxuries have become cheaper and more accessible, the essentials, particularly housing, have become dramatically less affordable (Collinson and Judge 2017; Corlett and Clarke 2020).
Throughout this post, average refers to the mean, unless otherwise specified.
A Brief Economic History Lesson
The pattern of wealth inequality, high before WWII, compressed during the mid-20th century, and rising again since the 1980s, is one of the major themes in the work of economists like Thomas Piketty, Emmanuel Saez, and Gabriel Zucman. Here’s a concise breakdown of the causes behind this U-shaped trajectory of inequality in the West:
1. Pre-WWII High Inequality (Late 19th Century–1930s)
Key causes:
High returns to capital: In agrarian and early industrial economies, capital (land, factories, and financial assets) earned steady, often high, returns—r > g, meaning the return on capital (r) exceeded the economic growth rate (g). This led to capital accumulation and dynastic wealth (Piketty, 2014).
Weak redistribution mechanisms: Limited taxation and minimal social spending meant wealth concentrated at the top.
Inheritance: Large fortunes were passed down with little taxation, reinforcing long-standing inequality.
2. Mid-20th Century Compression (1945–late 1970s)
Why inequality dropped:
Destruction of capital: WWII devastated physical capital (especially in Europe), wiping out elite wealth. Germany and Japan lost 20–30% of their capital stock (Piketty, 2014).
Inflation and national debt: Postwar inflation eroded the real value of wealth and war bonds disproportionately held by the rich.
Progressive taxation: High top income tax rates (often above 80% in the US and UK), wealth taxes, and estate duties curbed rentier accumulation.
Welfare state expansion: Strong government spending on healthcare, education, and pensions redistributed income.
Strong unions and wage compression: Labour had more bargaining power, leading to equitable wage growth.
3. Recent Rebound in Inequality (1980s–Present)
What changed:
Policy reversals: Tax cuts (e.g. Reagan, Thatcher), financial deregulation, and reduced estate taxes favoured the wealthy.
Globalisation and automation: Capital became more mobile than labour, suppressing wages and boosting returns to shareholders.
Privatisation and decline of unions: Weak labour protections and the shrinking of public services tilted bargaining power towards capital owners.
Asset inflation: Real estate, equities, and other capital assets surged in value, mainly benefiting those who already owned them.
Financialisation: A larger share of profits came from the finance sector, exacerbating inequality (Krippner, 2011).
The r > g Mechanism
In Piketty’s famous equation, when r (return on capital) > g (economic growth), wealth accumulates faster than incomes grow which leads to inequality. During the postwar era, g was high (due to reconstruction, productivity, and demographics), and r was depressed by taxes, capital destruction, and financial repression. Since the 1980s, economic growth has slowed whilst returns to capital have rebounded, reviving the r > g dynamic.
Left unchecked, capitalism has a natural tendency to concentrate wealth in fewer hands, rewarding ownership over effort, and, over time, entrenching inequality as economic advantage begets more advantage.
Post-War Prosperity: When Workers Prospered
From the late 1940s through the 1970s, much of the Western world experienced an economic golden age. This period was marked by:
Strong real wage growth, closely tracking productivity (Gordon 2016).
Secure, well-paying jobs in manufacturing and unionised sectors (Bryson and Forth 2017).
Widespread homeownership, even on modest single incomes (Stephens, Whitehead, and Munro 2005).
Low wealth inequality, supported by progressive taxation and estate duties (Piketty 2014).
Affordable essentials, including housing, education, and healthcare (OECD 2008).
Governments supported housebuilding and homeownership through direct provision, subsidies, and favourable mortgage conditions. In the UK, the 1950s and 60s saw annual completions exceed 300,000 homes, driven by both public and private investment (Scanlon, Whitehead, and Blanc 2017). At the time, average house prices were roughly three times annual earnings.
The Consumer Boom vs The Asset Squeeze
Since the 1980s, a paradox has emerged: consumer luxuries have become democratised, whilst core life necessities have become scarcer and more expensive. Consider:
More affordable than ever:
International holidays (Thompson 2019).
Smartphones and electronics (Byrne and Corrado 2017).
Clothing and homewares (ONS 2022).
Entertainment (Netflix, Spotify) and digital services.
Food variety and international cuisine (Pew Research Center 2016).
More expensive or harder to access:
Housing, both to rent and to buy (Resolution Foundation 2023).
Higher education, especially in the UK and US (IFS 2022).
Childcare and early years education (OECD 2020).
Long-term care and later-life security (IFS 2021).
Secure retirement saving, due to shift from DB to DC pensions (Warren 2016).
This reflects a deeper economic shift: capital assets have inflated in value, whilst labour income has stagnated (Saez and Zucman 2016; Stansbury and Summers 2020).

Figure 1. The chart above tracks UK university tuition fees from 1950 to 2023, adjusted for inflation into 2023 pounds. It tells a striking story of how access to higher education has evolved from a publicly funded right to a significant personal financial commitment.
1950 to the late 1990s: Tuition was entirely free. For decades, the idea of charging students was politically unthinkable, education was seen as a public good, funded by the state.
1998: A turning point. Tuition fees of £1,000 per year were introduced under the Labour government. In real terms, this marked the first meaningful financial burden placed on students.
2004 and 2010: Fees were raised to £3,000, then to £3,225, continuing the trend of shifting costs from the public to the individual.
2012: The most dramatic change occurred, the cap was lifted to £9,000, and later to £9,250, where it remains today. In inflation-adjusted terms, this represents a fivefold increase in just over two decades.
Students are paying more than ever before in real terms, despite often facing stagnant graduate wages, higher housing costs, and increased living expenses. Whilst university remains a valuable investment for many, the burden of funding it has clearly shifted across generations; adding yet another layer to the growing intergenerational inequality landscape.
Please see the ‘Chart References’ section at the bottom of this blog post for further information.
Housing: From Shelter to Speculative Asset
Housing has changed from a basic need to a wealth-building tool, one now largely out of reach for younger generations.
Financialisation: Property has become an investment vehicle for domestic and foreign capital (Aalbers 2016).
Restricted supply: Planning restrictions, green belts, and NIMBYism limit new developments in high-demand areas (Hilber and Vermeulen 2016).
Tax advantages: Owner-occupied housing benefits from favourable tax treatment in most countries (Adam et al. 2011).
Buy-to-let expansion: Landlords have gained from credit access and tax structures not equally available to first-time buyers (Scanlon and Whitehead 2016).
Inheritance effects: Housing wealth is now a key intergenerational transfer mechanism, reinforcing inequality (Hood and Joyce 2017).
The consequence is a generational divide: while Baby Boomers acquired homes when prices were low and interest rates manageable, Millennials and Gen Z face affordability ratios of 8–12× earnings, rising rents, and larger deposit requirements.
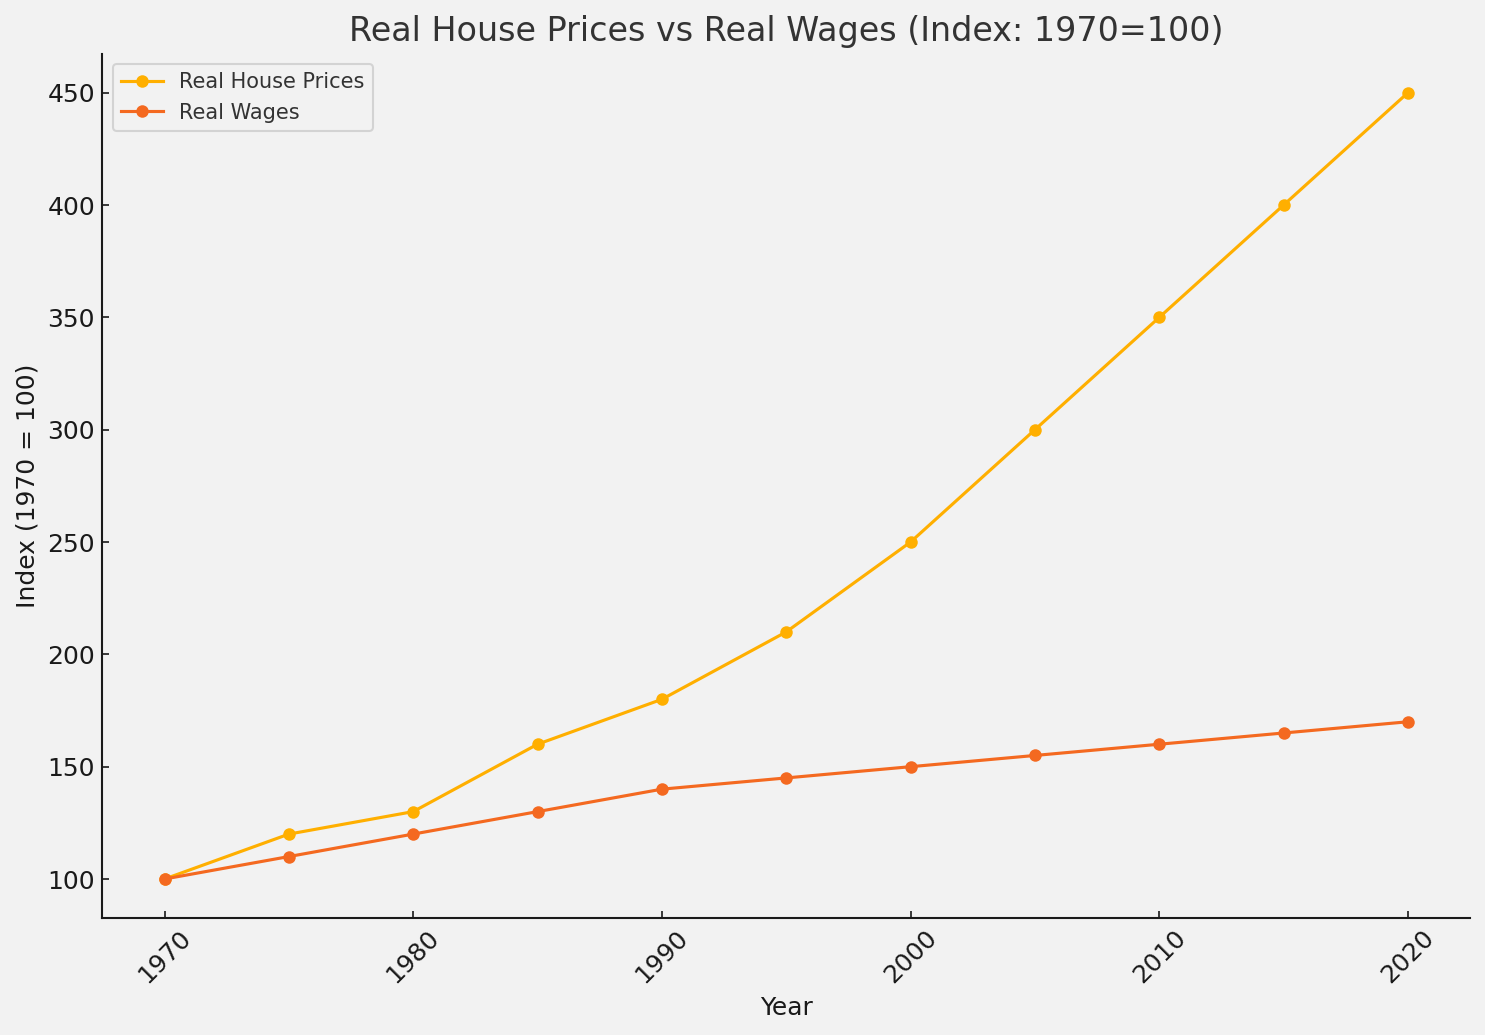
Figure 2. This chart compares the inflation-adjusted trajectory of real house prices and real wages in the UK, with both indexed to 1970 = 100.
Real house prices have risen by around 350% or more than 4.5× in real terms since 1970.
In contrast, real wages have only increased by around 70% over the same period.
The increased divergence begins around the mid-1990s, accelerating post-2000—driven by factors such as:
Loose credit and low interest rates.
A surge in buy-to-let investment.
Planning restrictions and supply shortages.
Global capital inflows into UK housing.
This growing gap between earnings and housing costs highlights how homeownership has become increasingly unattainable, particularly for younger and lower-income households.
Please see the ‘Chart References’ section at the bottom of this blog post for further information.

Figure 3. This chart tracks the ratio of average house prices to average incomes in the UK from 1950 to 2025.
In the 1950s and 60s, house prices were around 3× average annual income.
By 2020, this ratio had climbed to over 12× in some regions, with a national average between 8× and 12×.
The steepest rises occurred between 1997 and 2007, coinciding with deregulation of mortgage markets and a major credit expansion.
This ratio is a core indicator of housing affordability, and its rise illustrates the growing disconnect between what people earn and what housing costs; a structural shift with serious intergenerational implications.
Please see the ‘Chart References’ section at the bottom of this blog post for further information.
The Intergenerational Divide in Ownership
The Resolution Foundation (2023) shows that, in the UK at age 30:
64% of Baby Boomers owned a home.
54% of Generation X owned a home.
Just 28% of Millennials owned a home.
At the same time, young people face longer commutes, less job mobility, and weaker wealth accumulation. Property is increasingly inherited, not earned, an inversion of the post-war ideal of equal opportunity (Bourquin, Joyce, and Norris Keiller 2019).
Wealth, Wages, and the Bank of Mum and Dad
Beyond ownership rates, the path to buying a home is increasingly shaped not by earnings, but by access to family wealth.
Millennials and Gen Z face stagnant wages, crippling deposits, and tighter credit checks.
The average first-time buyer deposit is now more than 100% of the average annual salary (IFS 2022).
Meanwhile, the so-called ‘Bank of Mum and Dad’ has become the UK's ninth largest mortgage lender (Legal & General 2023).
In 2023, nearly half of all first-time buyers under 35 received financial assistance from family, either through gifted deposits, guaranteed mortgages, or rent-free living whilst saving (Legal & General 2023).
The consequence is clear: parental wealth has become a key determinant of home ownership. This represents a profound shift away from the post-war model, where secure employment and rising wages were enough to secure a home.
A New Shape to Inequality
What we are witnessing is a transformation in the structure of inequality:
Consumer goods have become cheaper and widely available, improving material consumption.
But core life outcomes, housing, education, financial security, are more unequal and less accessible without pre-existing wealth.
This reflects a broader shift from an economy driven by wage income to one shaped by asset ownership (Piketty and Zucman 2014; Goodhart and Pradhan 2020).
In short, you may be able to afford luxuries like the iPhone or an exotic getaway, but you may well not be able to afford the essentials like a home to live in.
References
Adam, S., J. Browne, W. Elming, and D. Phillips. 2011. A Survey of the UK Tax System. Institute for Fiscal Studies.
Aalbers, M. B. 2016. The Financialization of Housing: A Political Economy Approach. London: Routledge.
Bourquin, P., R. Joyce, and A. Norris Keiller. 2019. Living Standards, Poverty and Inequality in the UK: 2019. Institute for Fiscal Studies.
Bryson, A., and J. Forth. 2017. ‘The Evolution of the Modern Workplace in Britain’. National Institute Economic Review 240 (1): R39–R52.
Byrne, D., and C. Corrado. 2017. ‘ICT Prices and ICT Services: What Do They Tell Us About Productivity and Technology?’ Economics of Innovation and New Technology 26 (3): 239–51.
Collinson, P., and C. Judge. 2017. ‘House Prices in UK Now Almost Eight Times Earnings’. The Guardian, 3 April.
Corlett, A., and S. Clarke. 2020. Home Improvements: Action to Make Housing More Affordable. Resolution Foundation.
Gordon, R. J. 2016. The Rise and Fall of American Growth: The US Standard of Living Since the Civil War. Princeton University Press.
Goodhart, C., and M. Pradhan. 2020. The Great Demographic Reversal: Ageing Societies, Waning Inequality, and an Inflation Revival. Palgrave Macmillan.
Hilber, C. A. L., and W. Vermeulen. 2016. ‘The Impact of Supply Constraints on House Prices in England’. Economic Journal 126 (591): 358–405.
Hood, A., and R. Joyce. 2017. Inheritance and Inequality over the Life Cycle: IFS Briefing Note BN180. Institute for Fiscal Studies.
IFS. 2022. Living Standards, Poverty and Inequality in the UK: 2022. London: Institute for Fiscal Studies. https://ifs.org.uk
Institute for Fiscal Studies. 2021. Later Life Inequality in the UK.
Institute for Fiscal Studies. 2022. Higher Education Funding: Who Pays and When?
Krippner, G. (2011). Capitalizing on Crisis: The Political Origins of the Rise of Finance. Harvard University Press.
Legal & General. 2023. The Bank of Mum and Dad 2023: Supporting the Next Generation. https://group.legalandgeneral.com
OECD. 2008. Growing Unequal? Income Distribution and Poverty in OECD Countries.
OECD. 2020. Is Childcare Affordable? OECD Policy Brief.
Office for National Statistics (ONS). 2022. Consumer Trends: Trends in UK Household Spending.
Pew Research Center. 2016. The New Food Fights: How Gen Z and Millennials Approach Food Differently.
Piketty, T. 2014. Capital in the Twenty-First Century. Cambridge, MA: Harvard University Press.
Piketty, T., and G. Zucman. 2014. ‘Capital Is Back: Wealth-Income Ratios in Rich Countries 1700–2010’. Quarterly Journal of Economics 129 (3): 1255–1310.
Resolution Foundation. 2023. A New Generational Contract: Tackling Inequality Between Young and Old.
Saez, E., and G. Zucman. 2016. ‘Wealth Inequality in the United States Since 1913: Evidence from Capitalized Income Tax Data’. Quarterly Journal of Economics 131 (2): 519–78.
Scanlon, K., and C. Whitehead. 2016. ‘The Profile of UK Private Landlords’. London School of Economics.
Scanlon, K., C. Whitehead, and F. Blanc. 2017. The Future of Social Housing. London School of Economics.
Stansbury, A., and L. H. Summers. 2020. ‘The Declining Worker Power Hypothesis’. Brookings Papers on Economic Activity.
Stephens, M., C. Whitehead, and M. Munro. 2005. Lessons from the Past, Challenges for the Future for Housing Policy: An Evaluation of English Housing Policy 1975–2000. Joseph Rowntree Foundation.
Thompson, R. 2019. The Growth of Low-Cost Travel and Its Impact on Global Tourism. UNWTO Working Paper.
Warren, T. 2016. ‘Work-Life Balance and the Pensions Crisis: A Gender Time Policy Approach’. Social Politics 23 (1): 20–45.
Chart References
Bank of England. 2016. A Millennium of Macroeconomic Data for the UK. London: Bank of England. https://www.bankofengland.co.uk/statistics/research-datasets
BBC News. 2024. “University Tuition Fees in England to Rise to £9,535 in 2025.” BBC News, March 27, 2024. https://www.bbc.co.uk/news/education-68653410
OECD. 2022. Real House Price Index and Real Wages. Paris: OECD Statistics. https://data.oecd.org
Office for National Statistics (ONS). 2023. Average Weekly Earnings Time Series. London: ONS. https://www.ons.gov.uk/employmentandlabourmarket
Corlett, Adam, and Stephen Clarke. 2020. Home Improvements: Action to Make Housing More Affordable. London: Resolution Foundation. https://www.resolutionfoundation.org
Hilber, Christian A. L., and Wouter Vermeulen. 2016. “The Impact of Supply Constraints on House Prices in England.” Economic Journal 126 (591): 358–405.
Stephens, Mark, Christine Whitehead, and Melissa Munro. 2005. Lessons from the Past, Challenges for the Future: An Evaluation of English Housing Policy 1975–2000. York: Joseph Rowntree Foundation.
UK Parliament. 2023. Student Support for Undergraduates across the UK: Briefing Paper CBP-10155. House of Commons Library. https://commonslibrary.parliament.uk/research-briefings/cbp-10155/