Featured and Latest Posts



How Fama and French Build Portfolios
The Fama–French models begin with portfolio construction, not regressions. The idea is to sort stocks on characteristics thought to be related to expected returns, form a small number of broad and diversified portfolios, and then study how average returns vary across those portfolios. The familiar factors are built directly from these same sorts, which is why the approach is so transparent and replicable. A simple 2×3 sort, for example, splits stocks into Small and Big, then into Low, Neutral, and High on a second characteristic, producing six portfolios whose return patterns act as a clean diagnostic.
Once the portfolios are formed, factor construction and testing are deliberately mechanical. Long–short factors compare High versus Low or Small versus Big whilst averaging across the independent variable to control for it. When more detail is needed, the same logic scales up to 5×5 sorts, producing 25 portfolios that show whether return patterns are smooth and monotonic rather than driven by a single breakpoint. These portfolios then serve as test assets in regressions, where the key question is whether factor exposures explain the differences in average returns between the portfolios created by the sorts, leaving little systematic alpha behind.
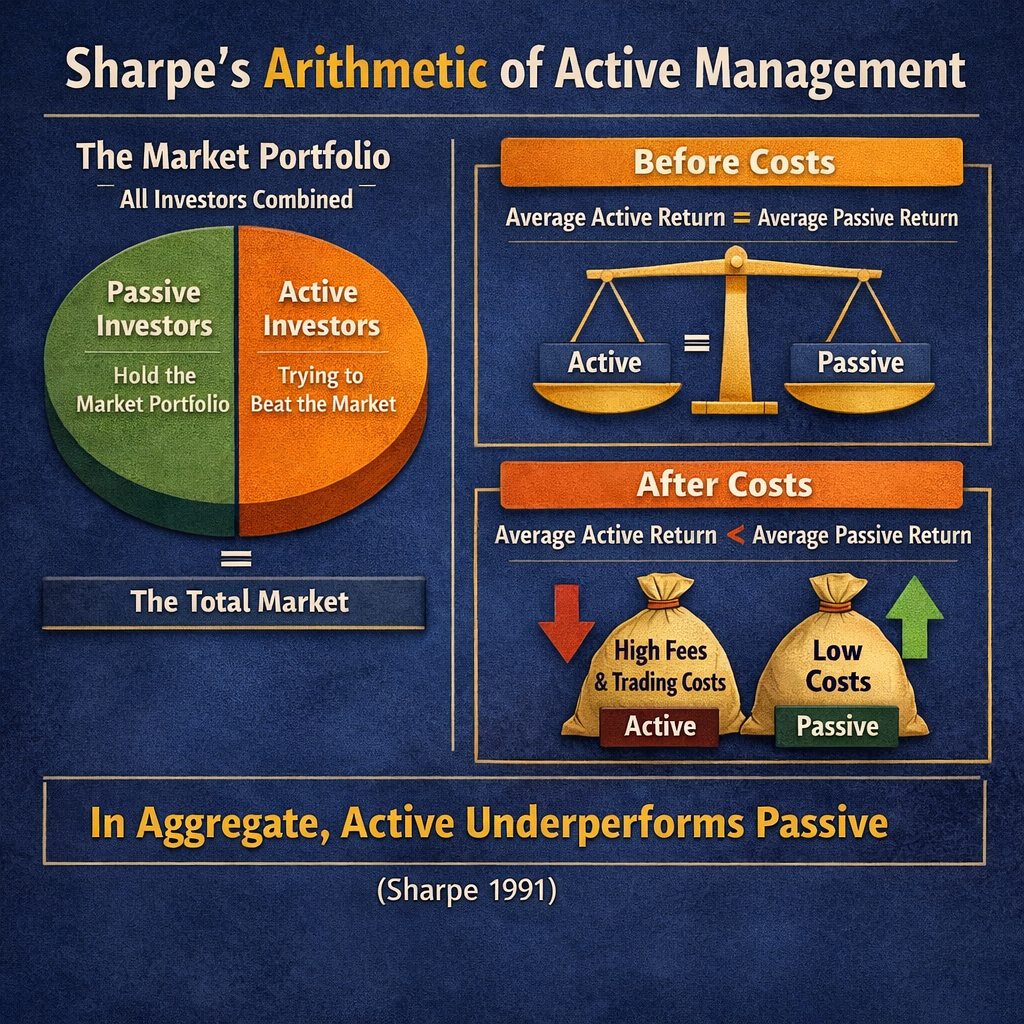
Sharpe’s Arithmetic, Revisited: When ‘Average Active’ Might Beat ‘Average Passive’ Before Costs
Sharpe’s ‘Arithmetic of Active Management’ is powerful because it is an accounting identity, not a claim about skill. If passive investors hold the market portfolio, then everyone else, collectively, must hold the same market portfolio too. That means, before costs, the average actively managed pound must earn the same return as the average passively managed pound. After costs, active underperforms in aggregate because it bears higher fees, turnover, and trading frictions.
The wrinkle is that the market portfolio is not static, and passive implementation is not continuous. Corporate actions reshape the investable set, whilst index trackers rebalance on rules and schedules, creating brief mismatches with the ‘instantaneous’ market. In that more realistic setting, average active can slightly outperform average passive before costs by intermediating those flows, without any special forecasting skill. But competition and costs still mean the core practical conclusion remains: passive tends to win after fees.

The Main Components of Bond Returns: Carry, Roll-down, and the Yield-curve Surprise
Bond returns can look deceptively simple: you lend money to a government or company, collect coupons, and get your principal back at maturity. The surprise is that, over short periods, even ‘safe’ bonds can fall sharply in value whilst still paying those coupons. That is not a glitch, it is just the market repricing what interest rates should be, and bond prices adjusting immediately.
A helpful way to think about it is that a bond’s return has three moving parts: what you get paid for holding it (carry), what you might gain simply because time passes on a normally upwards-sloping yield curve (roll-down), and the unpredictable bit (the yield-curve surprise). Carry and roll-down are the ‘expected’ components implied by today’s pricing. The surprise is ‘what the yield curve actually does’, and it can easily overwhelm the first two when interest rates change quickly.

Profitability and Investment Premia: What Fama–French’s ‘Quality’ Factors Mean for Investors
The Capital Asset Pricing Model (CAPM) assumes that a stock’s expected return is explained entirely by its sensitivity to the market portfolio: one factor, one beta. Yet in practice, the CAPM leaves much unexplained. Fama and French (1993) formalised these findings in their three-factor model, adding size (SMB) and value (HML) to the market factor.
Even then, further anomalies persisted. Portfolios sorted by profitability and investment intensity were not explained by the three-factor model. Fama and French (2015) expanded the framework to five factors, adding profitability (RMW—robust minus weak) and investment (CMA—conservative minus aggressive). This version explains the cross-section of returns more effectively, showing that much of what was previously attributed to value is better captured by profitability and investment.
For investors, RMW rewards exposure to firms with sustainable earnings, whilst CMA rewards avoiding those that pursue growth too aggressively. Profitability has been a consistent and defensive premium; investment more cyclical but valuable in filtering out overpriced growth.
Good financial decisions aren’t about predicting the future, they’re about following a sound process today.
In investing, outcomes are noisy. Short-term performance often reflects randomness, not skill. Yet fund managers continue to pitch five-year track records as if they prove anything. They don’t.
As Ken French puts it, a five-year chart ‘tells you nothing’. The real skill lies in filtering out the noise, evaluating strategy, incentives, costs, and behavioural fit.
Don’t chase what worked recently. Stick with what works reliably.