Featured and Latest Posts


How Regressions Work: A Simple Guide to Y, X, Alpha and Factor Models
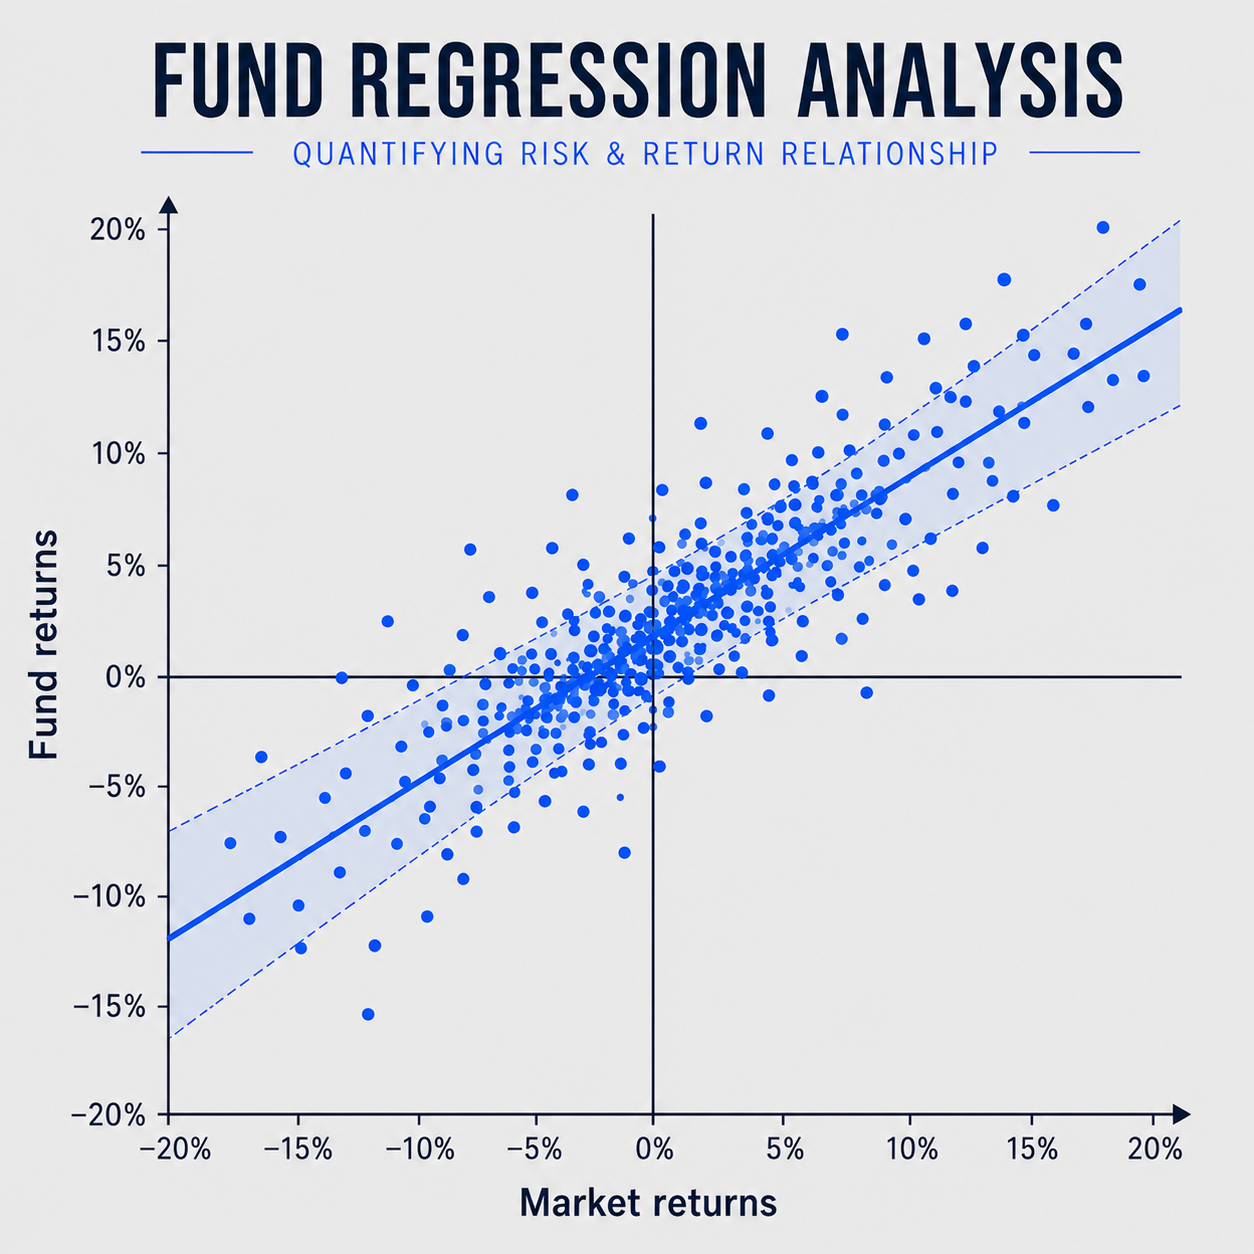
Regression analysis is widely used in investment research to understand what drives the returns of a fund, stock or portfolio. At its simplest, a regression measures how changes in one variable relate to changes in another. More advanced factor models extend this idea by examining whether an investment’s returns can be explained by its exposure to the market, smaller companies, value companies and other systematic factors.
The results help separate returns into factor-related performance, unexplained average return and period-by-period residuals. Alpha represents the return left unexplained by the factors included in the model, whilst coefficients measure the investment’s sensitivity to each factor. Statistics such as R², standard errors, t-statistics and confidence intervals then help assess how well the model explains the historical return pattern and how much confidence should be placed in its estimates.

Tracking Difference and Tracking Error
Tracking difference and tracking error are both used to judge how closely a fund follows its benchmark, but they answer different questions. Tracking difference tells you the actual return gap over a specific period: did the fund beat or lag the index, and by how much? For passive funds, this figure is often slightly negative because real-world funds face costs that an index does not, including ongoing charges, transaction costs and cash drag.
Tracking error, by contrast, tells you how variable that return gap was along the way. A fund can have a low tracking error whilst still consistently lagging the index by a small amount. Put simply, tracking difference is where the fund finished relative to the benchmark; tracking error is how smooth or erratic the journey was.
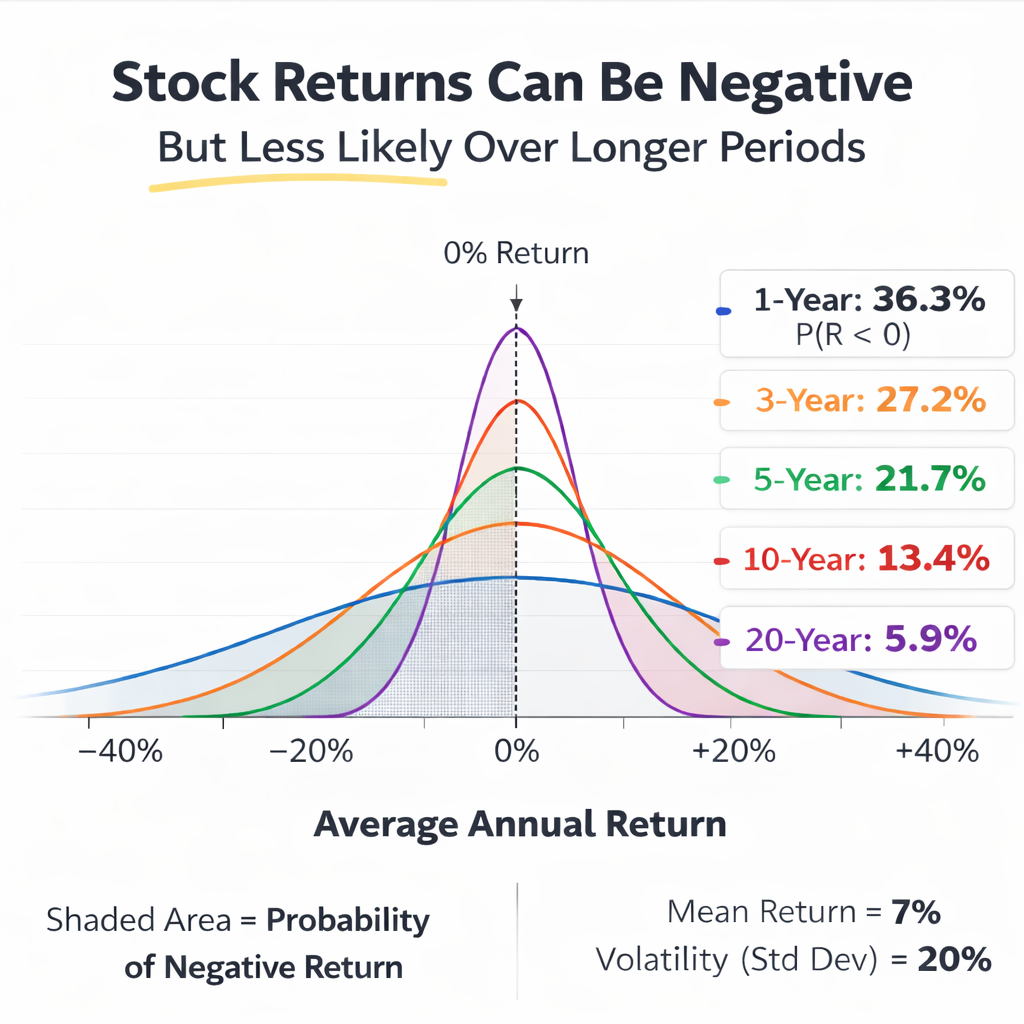
Negative Returns Are Normal
Recent market history can make it feel like stock markets mostly go up. That is understandable if your investing experience has been shaped by the post-2010 to 2025 period. The problem is that it can distort expectations about what ‘normal’ looks like. Negative returns are a routine part of equity investing, especially over short horizons.
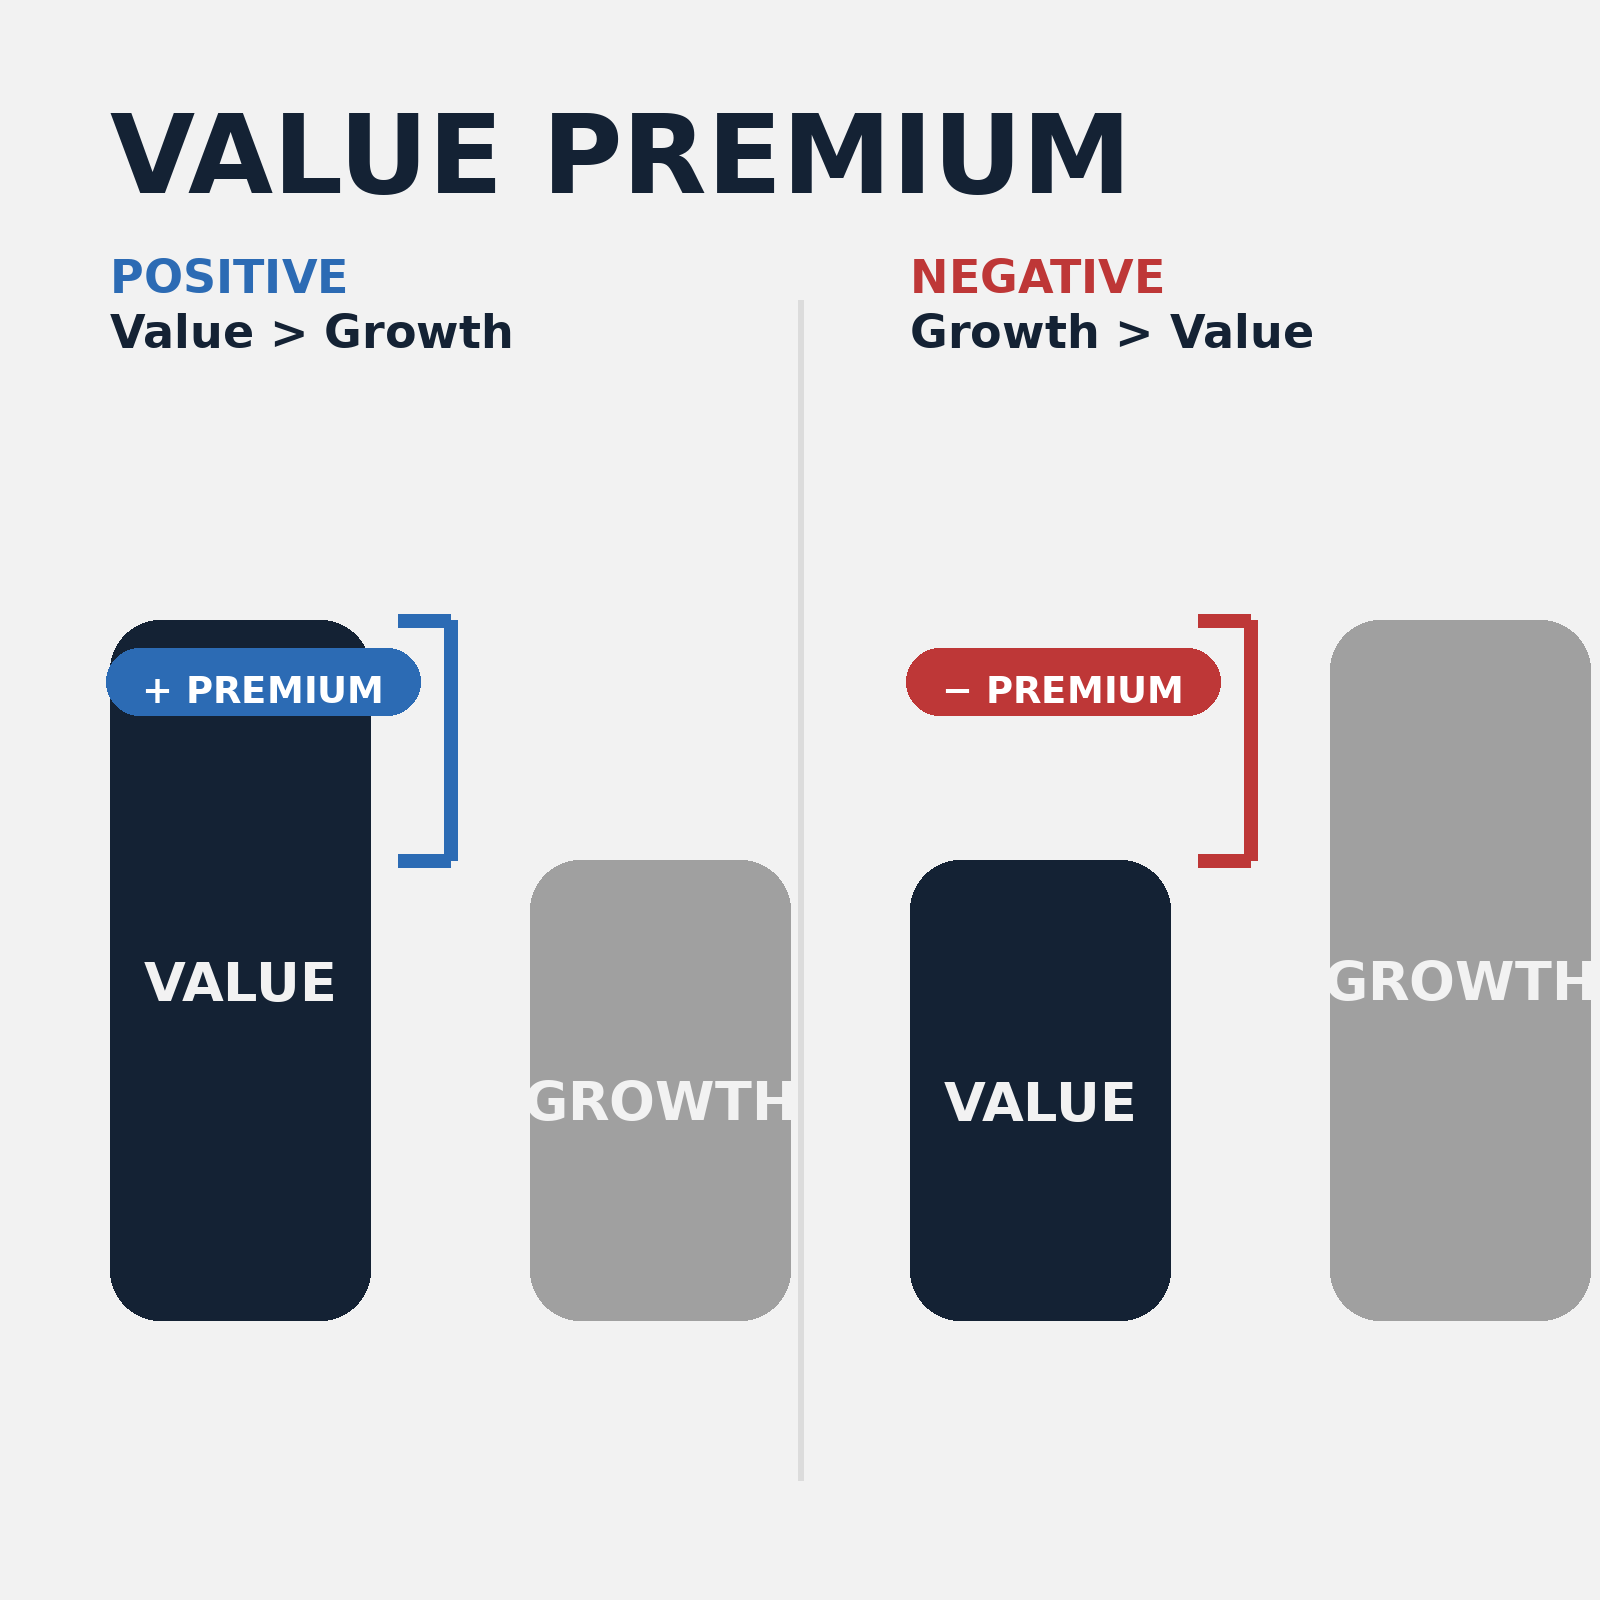
The Value Premium: Why ‘Cheap’ Stocks Have Tended to Win Long-term, but Why the Premium Often Feels ‘Dead’
Value is the tendency for cheap stocks, those trading on low valuations relative to fundamentals, to outperform expensive growth stocks over the long run. In the factor investing world, value is not a story first and a regression second. It is a portfolio idea: own the cheaper end of the market and underweight the priciest end, then accept the return pattern that comes with that positioning.
And that return pattern is the whole point. Value’s history is lumpy, with long stretches where it looks broken, followed by sharp recoveries that often arrive after investors have lost patience. That is why value is so hard to hold, because it can feel like you are wrong for years. Ironically, this is also why it can persist, either because it is genuinely riskier in the bad economic states that many investors fear, or because investors repeatedly overpay for glamour and underpay for dullness until expectations mean revert.
Good financial decisions aren’t about predicting the future, they’re about following a sound process today.
In investing, outcomes are noisy. Short-term performance often reflects randomness, not skill. Yet fund managers continue to pitch five-year track records as if they prove anything. They don’t.
As Ken French puts it, a five-year chart ‘tells you nothing’. The real skill lies in filtering out the noise, evaluating strategy, incentives, costs, and behavioural fit.
Don’t chase what worked recently. Stick with what works reliably.