Featured and Latest Posts


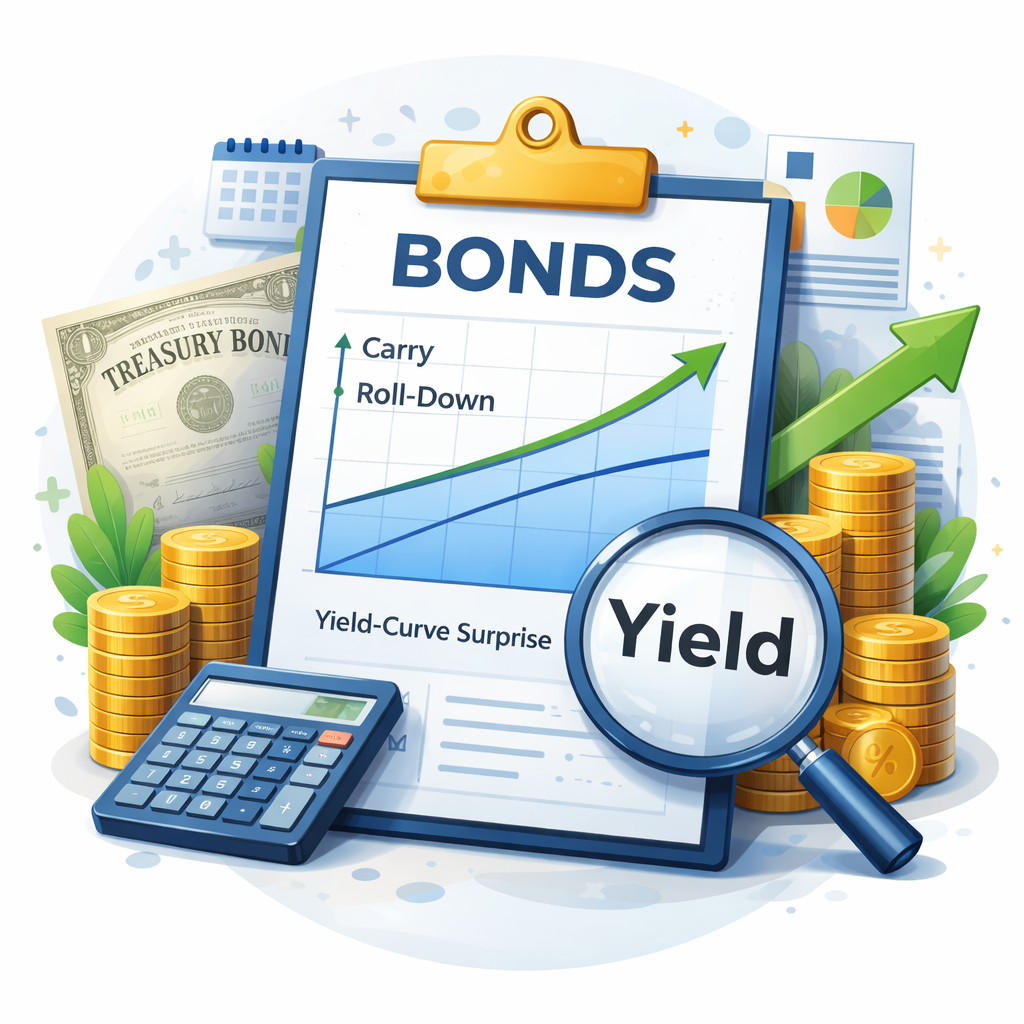
The Main Components of Bond Returns: Carry, Roll-down, and the Yield-curve Surprise
Bond returns can look deceptively simple: you lend money to a government or company, collect coupons, and get your principal back at maturity. The surprise is that, over short periods, even ‘safe’ bonds can fall sharply in value whilst still paying those coupons. That is not a glitch, it is just the market repricing what interest rates should be, and bond prices adjusting immediately.
A helpful way to think about it is that a bond’s return has three moving parts: what you get paid for holding it (carry), what you might gain simply because time passes on a normally upwards-sloping yield curve (roll-down), and the unpredictable bit (the yield-curve surprise). Carry and roll-down are the ‘expected’ components implied by today’s pricing. The surprise is ‘what the yield curve actually does’, and it can easily overwhelm the first two when interest rates change quickly.
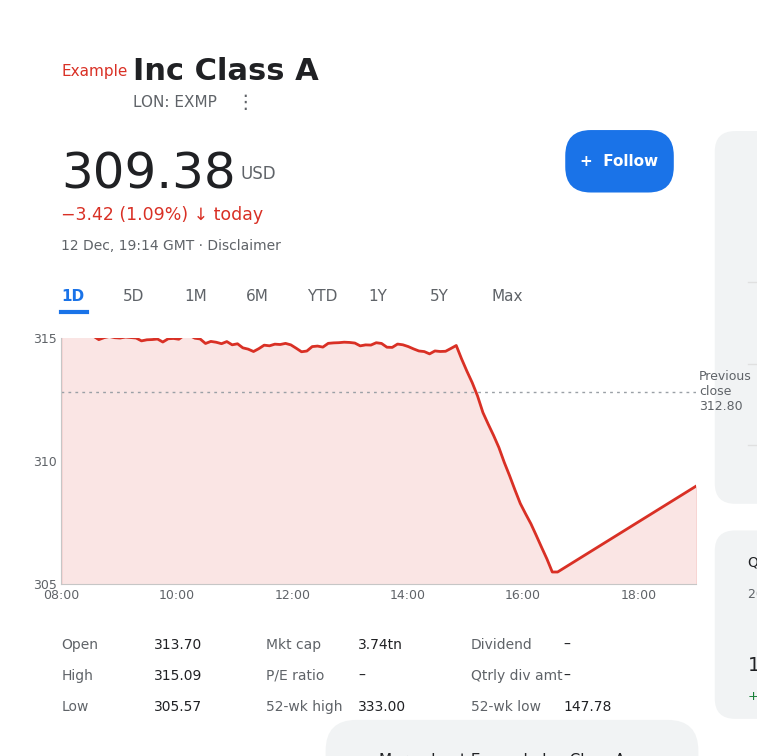
What Equity Returns Really Are
When people talk about ‘equity returns’, they often mean whatever percentage the market delivered last year. That is fine for storytelling, but it is not a definition. A cleaner starting point is price return versus total return: price return is just the change in the share price, whilst total return includes cashflows, typically assuming they are reinvested.
From there, returns can be broken into what must add up mechanically: shareholder yield, nominal earnings growth, and changes in valuation multiples. Yield is broader than dividends alone, because shareholders can also benefit from buybacks and sensible capital allocation, including debt reduction or reinvestment when expected ROIC is attractive. Valuation changes can dominate in the short run, but they are the least reliable piece to ‘count on’, which is why this decomposition keeps return expectations honest.
Cash, Accruals, Intangibles and Sector Effects: What Really Separates Avantis and Dimensional?
Avantis and Dimensional are often grouped together for good reason. Both sit firmly within the evidence-based investing tradition, draw heavily on the academic asset-pricing literature, and reject discretionary stock picking in favour of systematic exposure to well-documented sources of expected return. That shared philosophy is no accident. Avantis was founded by former Dimensional professionals and reflects the same intellectual lineage: factor investing grounded in theory, long-run evidence and practical implementability.
Where the firms differ is not in ideology, but in execution. The key distinctions centre on how accounting data are interpreted and adjusted when constructing value and profitability signals. In particular, two related but distinct debates drive much of the divergence: how profitability should be measured, especially whether earnings should be adjusted to be more cash-like by stripping out accruals, and how book equity should be defined in an economy dominated by intangible assets. Together, these design choices explain much of the subtle but meaningful difference between Avantis and Dimensional, differences that ultimately reflect alternative trade-offs between accounting precision and robustness rather than fundamentally different views on markets.

The Total Costs of Investing
Investors often focus on the headline fee of a fund whilst overlooking the many other frictions that quietly erode returns. The Ongoing Charges Figure is only the starting point. Trading and transaction costs, platform fees, taxes, spreads, incentive structures and even investor behaviour all contribute to the true cost of ownership. Some of these costs are explicit and easy to measure, whilst others are embedded within performance and only reveal themselves over time. Understanding this wider cost ecosystem allows investors to minimise unnecessary frictions, pay consciously for genuine value and keep a greater share of the capital markets’ long term rewards.
Good financial decisions aren’t about predicting the future, they’re about following a sound process today.
In investing, outcomes are noisy. Short-term performance often reflects randomness, not skill. Yet fund managers continue to pitch five-year track records as if they prove anything. They don’t.
As Ken French puts it, a five-year chart ‘tells you nothing’. The real skill lies in filtering out the noise, evaluating strategy, incentives, costs, and behavioural fit.
Don’t chase what worked recently. Stick with what works reliably.